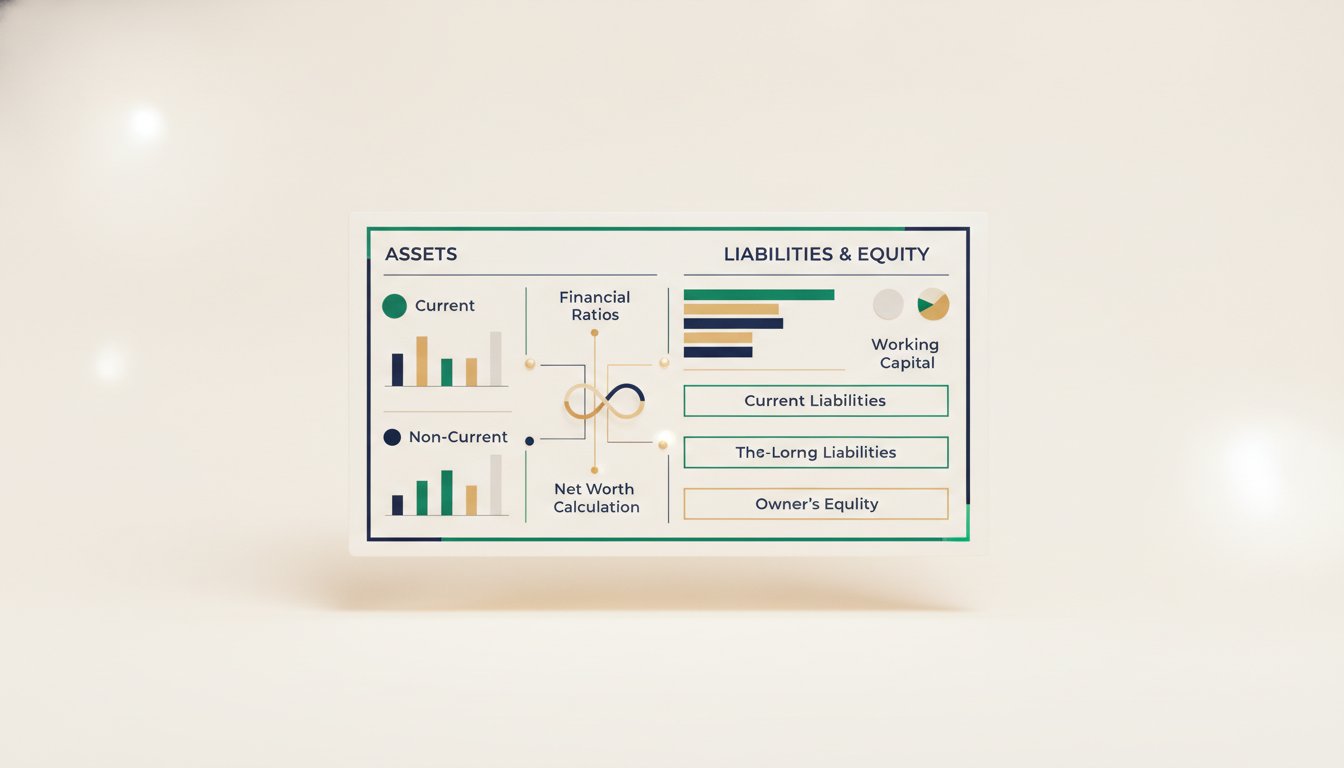
Why Your Balance Sheet Is a Diagnostic Tool, Not Just a Compliance Document
A balance sheet is often filed away after a loan application and never looked at again. That is a missed opportunity. Small business balance sheet analysis is the process of examining your company's assets, liabilities, and equity to diagnose financial health and predict future performance. It reveals whether you have the liquidity to survive a slow month, the debt structure to fund growth, and the net worth that determines your business's sale value.
Most business owners treat the balance sheet as a snapshot required by their accountant at tax time. In reality, it functions like a set of vital signs. The balance sheet tells you if your business can pay its bills in 30 days, whether you are over-leveraged, and if your equity is growing or shrinking.
The 2024 Small Business Credit Survey found that employment growth and revenue expectations held steady among employer firms, but financial fragility remains a top concern.1 A balance sheet reveals solvency by comparing total assets to total liabilities, showing whether a business can meet long-term obligations.2 Without this diagnostic view, owners make decisions based on bank account balances alone — a dangerous shortcut.
Consider a hypothetical landscaping company with $200,000 in the bank but $180,000 in accounts payable due within 30 days. The bank balance looks healthy, but the balance sheet shows a current ratio near 1.0, signaling minimal cushion. The diagnostic value is in the ratio, not the raw number.
The Balance Sheet vs P&L: What Each Actually Tells You
The profit and loss statement (P&L) tells you if you made money last month. The balance sheet tells you if you will survive next month. They answer different questions.
| Question | Answered By | Why It Matters |
|---|---|---|
| Did we sell enough to cover costs? | P&L | Measures operational efficiency |
| Can we pay suppliers next week? | Balance Sheet | Measures short-term liquidity |
| Is the business worth more than last year? | Balance Sheet | Measures equity growth |
| Are we spending more than we earn? | P&L | Measures profitability trend |
A business can show strong P&L revenue growth while the balance sheet reveals deteriorating working capital. For example, a hypothetical SaaS company with $500K ARR might show 30% revenue growth on the P&L, but if accounts receivable days have stretched from 30 to 60, the balance sheet signals that cash collection is falling behind. The P&L shows the story of what happened; the balance sheet shows the story of what is happening now.
Why Your Accounts Receivable Balance Signals Cash Flow Trouble
Accounts receivable (AR) is money customers owe you. A growing AR balance on the balance sheet means you are making sales but not collecting cash. This is the most common hidden drain on SMB liquidity.
82% of small businesses fail due to cash flow mismanagement, not lack of profitability, making balance sheet liquidity analysis critical.3 The AR line item is the first place to look. If AR has grown faster than revenue over three months, your customers are paying slower. That delay creates a cash gap: you must pay employees and suppliers while waiting for customer payments.
4 That is capital that cannot be used for payroll, inventory, or growth. The balance sheet makes this invisible drain visible.
How to Spot Inventory Problems Before They Hit Your Margins
Inventory appears as an asset on the balance sheet, but not all inventory is good inventory. Slow-moving or obsolete inventory ties up cash and incurs storage costs, reducing your working capital.
Working capital (current assets minus current liabilities) directly connects to cash flow; negative working capital often precedes insolvency.4 For a retailer, inventory is typically the largest component of current assets. If inventory grows while cost of goods sold stays flat, the business is accumulating stock it cannot sell.
Consider a hypothetical boutique retailer with $150,000 in inventory and $50,000 in monthly cost of goods sold. That represents three months of inventory on hand. If the industry average is 60 days, the retailer has excess stock worth roughly $50,000 sitting on shelves — for example, slow-moving seasonal items that tie up cash without generating revenue. The balance sheet reveals this inefficiency that the P&L hides until a write-down occurs.
Debt Structure Red Flags That Kill Acquisition Deals
When a buyer evaluates your business, the first thing they examine is the liability side of the balance sheet. The debt-to-equity ratio shows how much a company is leveraged; high ratios indicate reliance on borrowed funds and higher risk.5
| Debt-to-Equity Ratio | Risk Level | Buyer Reaction |
|---|---|---|
| Below 1.0 | Low | Clean acquisition target |
| 1.0 to 2.0 | Moderate | May require debt restructuring |
| Above 2.0 | High | Likely deal-breaker without equity injection |
A hypothetical manufacturing business with $800,000 in total liabilities and $400,000 in equity has a debt-to-equity ratio of 2.0. A buyer would likely require the owner to pay down debt before closing or reduce the purchase price to account for the risk. The balance sheet reveals this years before a sale conversation begins.
Short-term debt structure matters too. If a business has a $200,000 line of credit classified as current liability and only $50,000 in cash, the buyer sees a liquidity risk that must be resolved before any deal proceeds.
The Equity Section: What Investors and Buyers Actually Scrutinize
Equity is the residual value of the business after liabilities are subtracted from assets. Small business net worth calculation starts here: total assets minus total liabilities equals owner's equity. Investors and buyers look at retained earnings — the accumulated profit kept in the business — as a signal of discipline.
A business with $500,000 in retained earnings and $50,000 in owner draws shows a founder who reinvests in growth.5 A business with the same retained earnings but $450,000 in draws shows a founder treating the company as a personal checking account.5 Both have the same net worth on paper, but the second signals risk to an acquirer.
Small business confidence declined in Q1 2025 per the MetLife/US Chamber Index, making balance sheet-driven decision-making more urgent.6 In a cautious economic environment, buyers pay a premium for businesses with clean equity sections and consistent retained earnings growth.
Using Balance Sheet Ratios to Set Your Next Growth Milestone
Balance sheet ratios translate raw numbers into actionable targets. The current ratio (current assets divided by current liabilities) measures short-term liquidity; a ratio below 1.0 signals potential cash flow trouble.7 A healthy target for most SMBs is between 1.5 and 2.0.
| Ratio | Formula | Healthy Range | What It Tells You |
|---|---|---|---|
| Current Ratio | Current Assets / Current Liabilities | 1.5 – 2.0 | Can you pay short-term obligations? |
| Quick Ratio | (Current Assets - Inventory) / Current Liabilities | 1.0 – 1.5 | Can you pay without selling inventory? |
| Debt-to-Equity | Total Liabilities / Total Equity | < 2.0 | How leveraged is the business? |
| Working Capital | Current Assets - Current Liabilities | Positive | Cash available for operations |
For a hypothetical consulting firm with $300,000 in current assets and $150,000 in current liabilities, the current ratio is 2.0. That is healthy. The next growth milestone might be increasing revenue without taking on new debt, which would maintain the ratio while growing absolute working capital. The balance sheet provides the benchmark for that decision.
Your Next Step
Pull your most recent balance sheet and calculate your current ratio and debt-to-equity ratio using the formulas above. If your current ratio is below 1.5 or your debt-to-equity ratio exceeds 2.0, those are the two numbers to address first. For a structured review of your balance sheet and a personalized action plan, email [email protected].
Footnotes
-
https://www.fedsmallbusiness.org/reports/survey/2025/2025-report-on-employer-firms ↩ ↩2
-
https://capsulecrm.com/blog/small-business-financial-health-a-guide-to-balance-sheets-and-income-statements ↩
-
https://www.venasolutions.com/blog/small-business-revenue-statistics ↩
-
https://www.xero.com/us/guides/balance-sheet-basics-for-small-business-owners ↩ ↩2 ↩3
-
https://www.thehartford.com/insights-center/finances/financial-health-checklist ↩ ↩2 ↩3
-
https://www.uschamber.com/co/run/finance/metlife-small-business-index ↩