The $500K Gate: When Bookkeeping Breaks and You Need Real-Time Cash Visibility
SMB finance infrastructure upgrade triggers are the specific revenue thresholds, operational complexity signals, and compliance events that indicate a business has outgrown its current financial management setup. When a company passes roughly $500K in annual revenue, the bookkeeping model that worked at around $200K begins to fail, and the gap between available data and actionable insight widens rapidly.
At $500K in annual revenue, the manual bookkeeping approach that served a startup through its early years starts producing dangerous blind spots. A business at this stage processes 50-100 transactions per month across one bank account and a credit card. The bookkeeper reconciles statements monthly, producing a profit and loss statement 15-20 days after month-end. By the time the founder sees the numbers, they describe a business that no longer exists.
The core problem is cash visibility. A monthly P&L shows profitability, but it does not show cash position in real time. Consider a hypothetical product business that generates $42,000 per month in revenue. If a single $15,000 supplier invoice arrives on the 10th and a major customer pays on the 45th day instead of net-30, the business can face a negative cash balance for two weeks without the founder knowing until the next reconciliation.1
Real-time cash visibility requires three components: daily bank feed integration, automated transaction categorization, and a rolling 13-week cash forecast. At roughly $500K in annual revenue, the upgrade from monthly bookkeeping to weekly or daily cash tracking is the first infrastructure trigger. The cost is typically $500–$1,500 per month for a cloud-based accounting stack with automated feeds, compared to $300–$600 for basic monthly bookkeeping.
When Your Business Outgrows Spreadsheet Finance
Spreadsheet finance works when a business has one revenue stream, one bank account, and fewer than 30 transactions per month. At roughly $1M in revenue, those conditions almost always break. The business now has multiple revenue channels, an inventory line, payroll for 5-15 employees, and possibly a second entity.
The failure mode is version control. A founder maintains a cash flow spreadsheet, the bookkeeper maintains a separate P&L in QuickBooks, and the tax accountant uses a third set of numbers for quarterly estimates. When these three sources disagree, the founder has no way to determine which is correct. In a survey of SMBs using cloud-based financial tools, 82% still lacked formal financial planning processes, meaning the spreadsheet remains the primary planning tool even as the business grows beyond its capacity.2
The upgrade trigger at this stage is reconciliation friction. If the founder spends more than two hours per week manually matching bank transactions to spreadsheet entries, or if the bookkeeper requires more than five days to close a month, the infrastructure has failed. The solution is a dedicated accounting system with bank feeds, automated categorization rules, and a chart of accounts designed for the business's specific revenue model.
The Five Signals That Trigger an Infrastructure Upgrade
Five specific signals indicate that a business has crossed a finance infrastructure complexity threshold. Each signal corresponds to a measurable operational condition, not a subjective feeling of being overwhelmed.
Signal 1: Multiple legal entities. When a business adds a second LLC, an S corporation election, or a holding company structure, consolidated reporting becomes necessary. A bookkeeper managing separate sets of books for each entity cannot produce a combined P&L without manual spreadsheet work.
Signal 2: Inventory complexity. A business carrying more than 50 SKUs or using multiple suppliers needs inventory valuation methods that basic bookkeeping software cannot handle without add-ons.
Signal 3: Multi-state payroll or sales tax. Once a business has employees or customers in three or more states, compliance complexity jumps significantly. Each state has different withholding rules, unemployment tax rates, and sales tax thresholds.
Signal 4: Debt or investor reporting. A business with a term loan, line of credit, or outside investors must produce monthly or quarterly reporting packages. Lenders and investors require GAAP-compliant financial statements, not management-adjusted P&L reports.
Signal 5: Cash flow volatility exceeding 30% month-over-month. If revenue or expenses fluctuate by more than 30% from month to month, a static annual budget is useless. The business needs rolling forecasts updated monthly.
When two or more of these signals are present simultaneously, the business has outgrown its current finance infrastructure and needs a structured upgrade.
Building the Stage-Gated Upgrade Roadmap
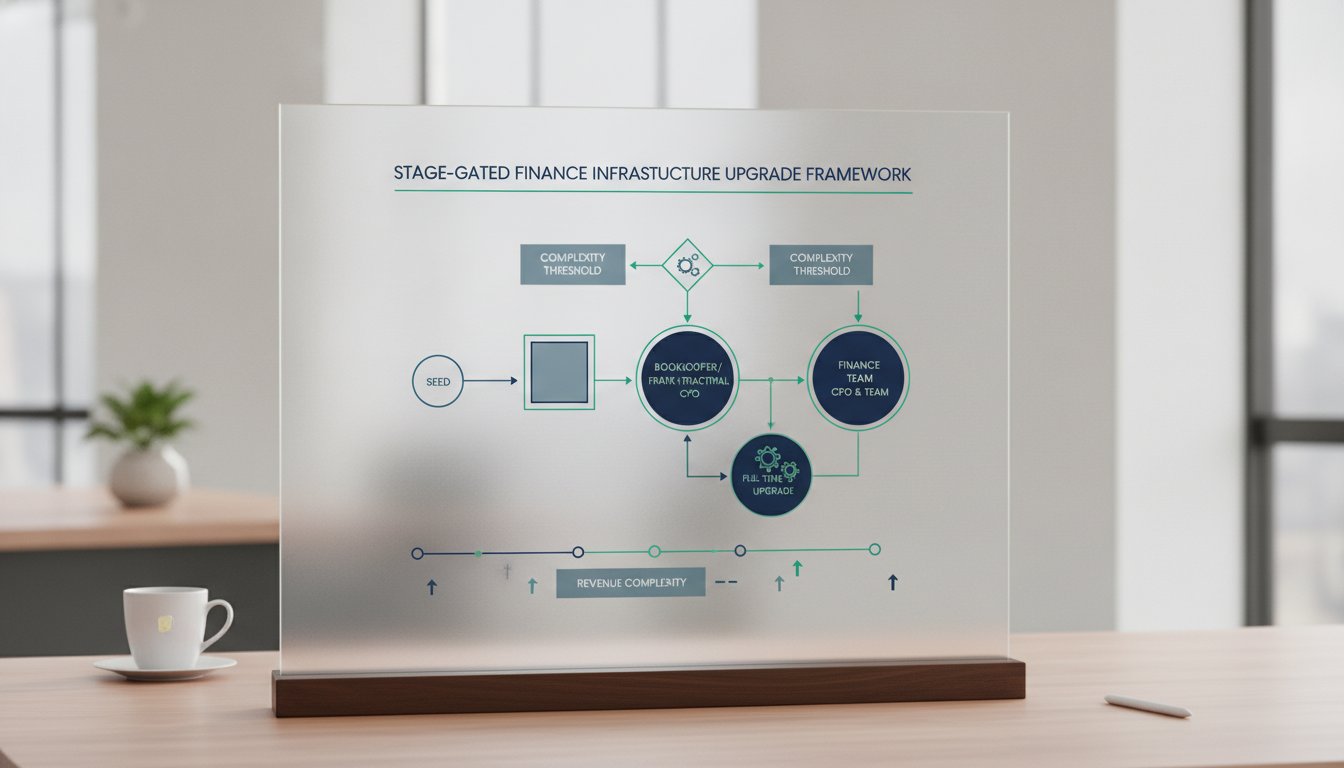
The stage-gate framework, originally developed for product development, applies directly to finance infrastructure upgrades.3 Each gate represents a decision point where the founder evaluates whether the current system still meets the business's needs before committing resources to the next upgrade.
| Gate | Revenue Range | Upgrade | Gate Question |
|---|---|---|---|
| 1 | $500K–$1M | Cloud-based accounting with automated bank feeds and weekly cash reporting | Can I see my cash position within 24 hours of the close of any business day? |
| 2 | $1M–$3M | Controller function for GAAP-compliant statements within 10 business days | Are my financial statements GAAP-compliant and available within 10 days of month-end? |
| 3 | $3M–$5M | Fractional CFO for strategic planning and 13-week cash forecasting | Do I have a rolling 13-week cash forecast and leading KPIs that predict my cash position 90 days out? |
Gate 1 (approximately $500K to $1M in revenue): Upgrade from basic bookkeeping to cloud-based accounting with automated bank feeds and weekly cash reporting. The gate question: "Can I see my cash position within 24 hours of the close of any business day?" If no, proceed with the upgrade.
Gate 2 (roughly $1M-$3M revenue): Add a controller function — either a part-time controller or a senior accountant who can produce monthly financial statements within 10 business days, manage AP/AR, and handle multi-entity consolidation. The gate question: "Are my financial statements GAAP-compliant and available within 10 days of month-end?" If no, proceed.
Gate 3 (approximately $3M-$5M revenue): Engage a fractional CFO for strategic financial planning, cash flow forecasting, KPI dashboard design, and investor or lender reporting. The gate question: "Do I have a rolling 13-week cash forecast and a set of leading KPIs that predict my cash position 90 days out?" If no, proceed.
Each gate includes a specific deliverable and a go/no-go decision. The framework prevents the common mistake of hiring a full-time CFO at, for example, $2M in revenue when what the business actually needs is a controller and better systems.
Cash Flow Forecasting at Each Maturity Stage
Cash flow forecasting capability must evolve alongside the business. At $500K in revenue, a simple 13-week forecast built in the accounting software with direct bank feed data is sufficient. The forecast should show expected inflows from known receivables, expected outflows from known payables, and the resulting daily cash balance.
At the stage where a business has many open receivables and payables, the forecast needs scenario modeling. A typical business at this stage might have 30-40 open receivables and 50-60 open payables at any given time. The forecast should include a base case, an upside case (top 10 customers pay on time), and a downside case (top 3 customers pay 15 days late).
At the stage where annual revenue reaches the mid-single-digit millions, the forecast becomes a strategic tool. It should incorporate seasonality, planned capital expenditures, debt service schedules, and tax payment dates. The forecast horizon extends to 12 months, with monthly updates and a quarterly reforecast. At this stage, the fractional CFO typically owns the forecast and presents it to the founder monthly with variance analysis and recommended actions.
Integrating Fractional CFO Oversight Without Overhead
A fractional CFO provides strategic financial leadership without the six-figure annual cost of a full-time hire. For a business at $3M-$5M revenue, a fractional CFO engagement typically runs 10-20 hours per month at $300-$500 per hour, totaling $3,000-$10,000 per month.
The integration model follows a standard structure. Month one focuses on assessment: reviewing the current chart of accounts, financial reporting process, cash flow forecasting method, and tax strategy. Month two implements improvements: setting up KPI dashboards, establishing a monthly reporting cadence, and creating a rolling forecast. Months three through six shift to strategic work: evaluating financing options, analyzing unit economics, and building financial models for growth scenarios.
The key to successful integration is clear role boundaries. The fractional CFO does not replace the bookkeeper or controller. The bookkeeper records transactions, the controller produces statements, and the CFO interprets those statements to guide strategy. When these roles are clearly defined, the total finance function cost for a $3M-$5M business ranges from $3,000-$8,000 per month — roughly 1-2% of revenue.
How to Sequence Tax Strategy, KPIs, and Reporting Upgrades
The most common sequencing mistake is prioritizing tax strategy before the underlying data is reliable. A tax strategy built on inaccurate financial data produces incorrect estimates and potential penalties. The correct sequence is: reporting infrastructure first, then KPIs, then tax strategy.
Step 1: Reporting infrastructure. Implement a chart of accounts designed for the business's revenue model. For a SaaS business, this means separating MRR, setup fees, and professional services into distinct revenue accounts. For a retailer, it means tracking COGS by product category. This step takes 2-4 weeks.
Step 2: KPI dashboard. Once the chart of accounts produces reliable data, build a dashboard with 5-7 leading KPIs. For most SMBs, these include: monthly recurring revenue (if applicable), gross margin percentage, customer acquisition cost, days sales outstanding, cash burn rate, and revenue per employee. This step takes 1-2 weeks.
Step 3: Tax strategy. With reliable financial data and KPI visibility, the business can implement tax strategies such as QBI deduction optimization, retirement plan selection (SEP IRA vs. 401(k)), and entity structure review. A fractional CFO or CPA with tax expertise handles this step, typically during Q3 or Q4 for the following tax year.
This sequence ensures that every tax decision is grounded in accurate data and that KPI improvements can be measured before tax strategy changes are implemented.
Measuring ROI on Each Finance Infrastructure Investment
Each infrastructure upgrade should produce measurable returns. The ROI calculation differs by upgrade type.
Bookkeeping to cloud-based accounting (for example, $500-$1,500/month): The primary return is time saved. A founder spending 10 hours per month on manual reconciliation at a typical opportunity cost of $200 per hour saves $2,000 per month. The net ROI is positive from month one.
Adding a controller (e.g., $3,000-$6,000/month): The return comes from error reduction and faster closing. A controller reduces month-end close from 15 days to 7 days, enabling faster decision-making. For a business with $2M in annual revenue, a 7-day faster close on a 60-day receivables cycle improves cash flow visibility by 12%.
Fractional CFO ($3,000-$10,000/month): The return comes from strategic decisions that improve margins or reduce costs. For example, a fractional CFO who identifies a pricing optimization that increases gross margin by 2 percentage points on $4M in revenue generates $80,000 in additional profit annually — a 2-3x return on the CFO engagement cost.
The 73% of SMBs planning to increase finance automation investment in 2025 are responding to these measurable returns.4 The key is to invest in the right upgrade at the right revenue stage, not to automate everything at once.
Your Next Step
Review your current finance infrastructure against the five signals listed above. If two or more signals are present, identify which gate your business has reached. A typical SMB at $500K in revenue faces different reporting gaps than one at $1M or $3M. Schedule a 30-minute assessment of your current reporting process, cash forecast capability, and chart of accounts structure with CurrentCFO to get a clear picture of where you stand and what comes next. Email [email protected] to schedule the assessment.
Footnotes
-
https://nationalbusiness.org/a-complete-guide-to-managing-small-business-finances ↩
-
https://compassapp.ai/research/smb-financial-planning-technology-adoption-2025 ↩
-
https://www.wellspring.com/blog/how-to-manage-your-innovation-process-the-stage-gate-framework ↩
-
https://lauriemccabe.com/2025/04/24/new-survey-report-reveals-how-smbs-are-transforming-finance-in-2025-and-whats-next ↩