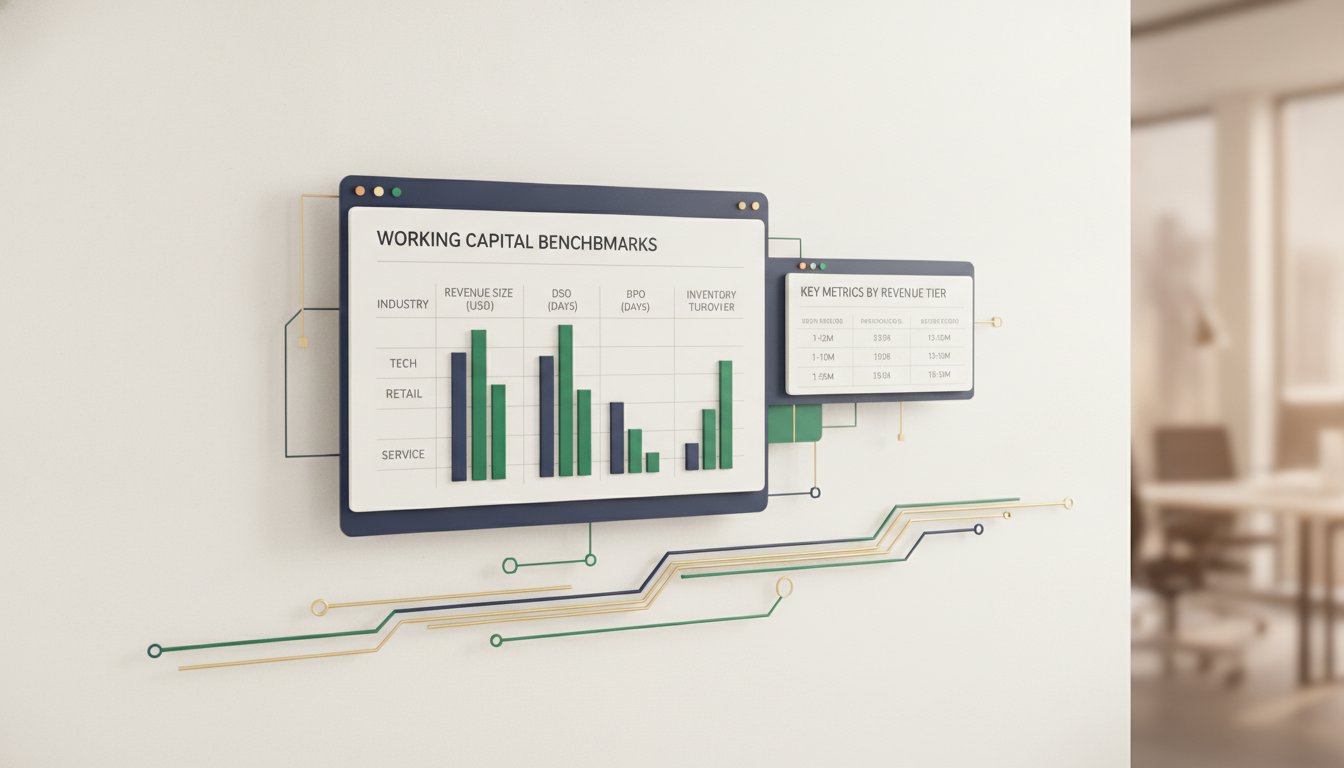
Why Revenue Size Changes Your Working Capital Targets
Small business working capital benchmarks by industry are the standard metrics that founders use to compare their cash conversion efficiency against peers at similar revenue levels. Without these benchmarks, owners cannot determine whether their 45-day collection cycle or 60-day payment terms signal strength or weakness relative to their industry.
A business generating $1 million in annual revenue operates with fundamentally different working capital dynamics than one at $10 million1. The reason is structural: smaller firms have less negotiating leverage with suppliers, fewer customers to diversify receivable risk, and thinner inventory buffers.
A business at $1 million in revenue faces a cash crisis when a single late-paying customer represents, for example, 20% of accounts receivable. At $10 million, that same customer might represent only 2% of receivables. This concentration risk means smaller businesses need tighter DSO targets than their larger peers, even within the same industry.
Supplier terms also shift with revenue. A $1 million manufacturer typically pays net-30 or net-45 because suppliers view them as higher risk. A $10 million manufacturer often negotiates net-60 or net-90 terms, improving their DPO by 15 to 30 days without any operational change2.
Inventory dynamics follow the same pattern. A retailer at $5 million revenue can afford to stock 60 days of inventory across multiple SKUs. A smaller retailer carrying the same 60-day supply has tied up a much larger percentage of their total capital, making inventory turnover a more critical metric for survival.
Why Working Capital Benchmarks Vary by Industry Revenue
Industry structure drives working capital norms more than any other factor. Service businesses collect faster than manufacturers because they deliver and invoice in the same cycle. Retailers hold physical inventory that manufacturers do not. Construction firms deal with milestone payments that stretch cash cycles unpredictably.
The U.S. Bank study found that 82% of small businesses fail due to cash flow mismanagement, not lack of profitability1. This statistic underscores why industry-specific benchmarks matter: a healthy DSO for a consulting firm would signal distress for a grocery store.
Revenue tier adds another layer. A $1 million SaaS company with monthly subscriptions might achieve DSO under 15 days because customers pay by credit card. A $1 million construction firm billing on net-60 terms might average 55 days. Both are healthy for their respective industries and revenue levels, but comparing them directly would mislead the owner.
The table below shows how the same metric varies across industries at the $1 million to $5 million revenue range:
| Industry | Typical DSO (days) | Typical DPO (days) | Inventory Turns (annual) |
|---|---|---|---|
| SaaS / Software | 15-30 | 30-60 | N/A |
| Professional Services | 30-45 | 30-45 | N/A |
| Manufacturing | 40-55 | 45-60 | 4-6 |
| Retail | 5-15 | 30-45 | 4-6 |
| Construction | 45-60 | 30-45 | N/A |
The Three Core Metrics Every SMB Owner Should Track
DSO measures how quickly customers pay their invoices. A lower number means faster cash collection. For small businesses under $50 million revenue, the median DSO is 45 days, while top-quartile firms achieve under 30 days2. A business at 60 days DSO is collecting 33% slower than the median peer, which directly reduces available cash.
DPO measures how long a business takes to pay its own suppliers. A higher number is generally better because it means the business holds cash longer before paying. Service businesses average 30 to 45 days DPO, while manufacturing firms average 45 to 60 days3. The gap between DSO and DPO — the cash conversion cycle — tells the real story.
Inventory turnover ratio measures how many times a year a business sells and replaces its inventory. Small retailers average 4 to 6 turns annually, but businesses under $5 million revenue often drop to 2 to 3 turns4. Each additional turn frees up cash that was previously sitting on shelves.
Consider a hypothetical retailer with $2 million in annual revenue and $400,000 in average inventory. At 3 inventory turns, they carry 120 days of stock. Improving to 5 turns would reduce inventory to roughly $240,000, freeing approximately $160,000 in cash without changing sales volume5.
Industry-Specific Working Capital Ranges for Under $5M Revenue
For businesses under $5 million revenue, working capital benchmarks cluster differently than published averages that include larger firms. The following table provides revenue-tiered ranges based on industry data:
| Metric | $1M Revenue | $3M Revenue | $5M Revenue |
|---|---|---|---|
| DSO — Services | 35-50 days | 30-45 days | 25-40 days |
| DSO — Manufacturing | 45-60 days | 40-55 days | 35-50 days |
| DPO — Services | 25-40 days | 30-45 days | 35-50 days |
| DPO — Manufacturing | 30-45 days | 35-50 days | 40-55 days |
| Inventory Turns — Retail | 2-3x | 3-4x | 4-5x |
| Inventory Turns — Manufacturing | 3-4x | 4-5x | 5-6x |
A service business at $1 million revenue with DSO of 55 days is outside the healthy range. The owner would need to examine whether invoicing delays, unclear payment terms, or customer concentration is driving the gap. A manufacturing firm at $5 million revenue with inventory turns of 3x is below the 5-6x target, suggesting excess stock or slow-moving product lines.
Only 37% of small businesses maintain a formal working capital forecast, according to a 2025 U.S. Chamber survey5. This means nearly two-thirds of owners are making cash flow decisions without knowing whether their metrics fall within or outside industry norms.
How Revenue Growth Changes Your Working Capital Needs
Small business working capital benchmarks by industry reveal that revenue growth does not automatically improve working capital. In fact, rapid growth often worsens it because receivables and inventory grow before the cash from those sales arrives.
A business growing from $1 million to $3 million typically sees DSO increase by 5 to 10 days during the transition. New customers demand longer payment terms. Larger orders require more inventory upfront. The cash conversion cycle stretches before the revenue increase stabilizes.
At $5 million to $10 million revenue, the dynamics shift again5. Suppliers offer better terms because the business has proven creditworthiness. Customers become more standardized, reducing collection variability. The business can afford dedicated finance staff to manage receivables and payables actively.
The SBA requires a minimum working capital ratio of 1.15:1 for 7(a) loan approval6. A business approaching $5 million revenue that wants to borrow for expansion must maintain this ratio. If DSO has crept to 55 days and inventory turns have dropped to 3x, the working capital ratio may fall below the threshold, blocking access to growth capital.
Seasonal Businesses vs Steady Revenue: Different Benchmarks
Seasonal businesses face a fundamentally different working capital challenge than steady-revenue businesses. A landscaping company generating, for example, 70% of revenue between April and September must finance inventory, payroll, and equipment during the off-season when cash inflows are minimal.
For seasonal businesses, the relevant benchmark is not a single DSO or DPO number but the peak-to-trough working capital requirement. A typical seasonal business needs working capital equal to 25% to 40% of annual revenue during the pre-season buildup period. A steady-revenue business with the same annual revenue might need only 10% to 15%.
Inventory turnover benchmarks also differ. A seasonal retailer turning inventory 6 times annually might achieve 4 of those turns in the fourth quarter alone. Measuring annual turns without seasonal context understates the efficiency of the peak period and overstates the off-season drag.
Consider a hypothetical seasonal business with $2 million in annual revenue. During the pre-season buildup, they might carry $300,000 in inventory and $150,000 in receivables while payables are only $100,000. The resulting working capital gap — roughly 17.5% of annual revenue1 — ties up a significant portion of cash flow. A steady-revenue business at the same revenue level might never exceed $100,000 in working capital needs.
Using Benchmarks to Spot Cash Flow Problems Early
Benchmarks function as early warning systems when tracked monthly. A DSO that moves from 40 days to 48 days over three months signals that collections are slipping. Without a benchmark, the owner might not notice until the bank account runs low.
The cash conversion cycle — DSO plus inventory days minus DPO — provides the single most useful diagnostic number. For a small manufacturer at $3 million revenue, a healthy cash conversion cycle might be 45 to 60 days. If the number reaches 75 days, the business is financing 15 to 30 extra days of operations without any revenue increase.
Tracking these metrics against industry benchmarks reveals whether the problem is internal or external. If DSO increases across the industry due to economic conditions, the owner's response should focus on cash reserves and supplier negotiations. If DSO increases only for their business, the issue is likely internal — slow invoicing, unclear terms, or weak collection processes.
A business that identifies a DSO problem early can implement changes within 30 to 60 days. A business that discovers the problem only when cash runs low faces a crisis that may require expensive financing or emergency cost cuts.
When to Bring in a Fractional CFO for Working Capital Strategy
Most SMB owners reach the limit of their working capital expertise at a revenue range where the business has enough complexity that owner intuition no longer suffices, but not enough revenue to justify a full-time CFO.
Signs that a fractional CFO would add value include: DSO consistently above industry benchmarks by 10 or more days, inventory turns below 3x for two consecutive quarters, or a cash conversion cycle that has lengthened significantly year-over-year without a clear explanation.
A fractional CFO brings benchmark data from dozens or hundreds of comparable businesses. They can identify whether a 50-day DSO is a collection problem, a customer concentration issue, or an industry norm. They can structure supplier negotiations to improve DPO without damaging relationships. They can build the working capital forecast that 63% of small businesses lack5.
The cost of a fractional CFO — typically $2,000 to $5,000 per month — is often offset by the cash freed through improved working capital metrics. For example, a business that reduces DSO by 10 days on $5 million in revenue frees approximately $137,000 in cash, a return that far exceeds the advisory cost.
Your Next Step
Pull your last three months of financial statements and calculate your DSO, DPO, and inventory turnover ratio. Compare each metric against the revenue-tiered benchmarks in this article. If any metric falls outside the healthy range for your industry and revenue level, identify the specific cause — slow-paying customers, excess inventory, or missed supplier terms. For a benchmark analysis tailored to your business, email [email protected].
Footnotes
-
https://www.usbank.com/financialiq/improve-your-business/manage-your-finances/cash-flow-management.html ↩ ↩2 ↩3
-
https://www.stuut.ai/blog/dso-by-company-size-benchmarks-and-improvement-tactics-for-small-mid-market-and-enterprise ↩ ↩2 ↩3
-
https://corporate.visa.com/content/dam/VCOM/corporate/solutions/documents/2024-25-middle-market-growth-corporates-working-capital-index.pdf ↩
-
https://www.forafinancial.com/blog/small-business/average-small-business-revenue ↩ ↩2