Why Fundraising Readiness Depends on Rolling Projections
Building rolling 12 month financial projections fundraising scenarios shows VCs you understand your unit economics, cash runway, and growth levers across multiple outcomes. A rolling 12-month financial projection for fundraising is a dynamic financial model that forecasts revenue, expenses, and cash flow over the next twelve months and is updated monthly to reflect actual performance and changing assumptions. Unlike a static annual budget, this rolling view gives founders and investors a continuously refreshed picture of runway, growth trajectory, and capital needs.
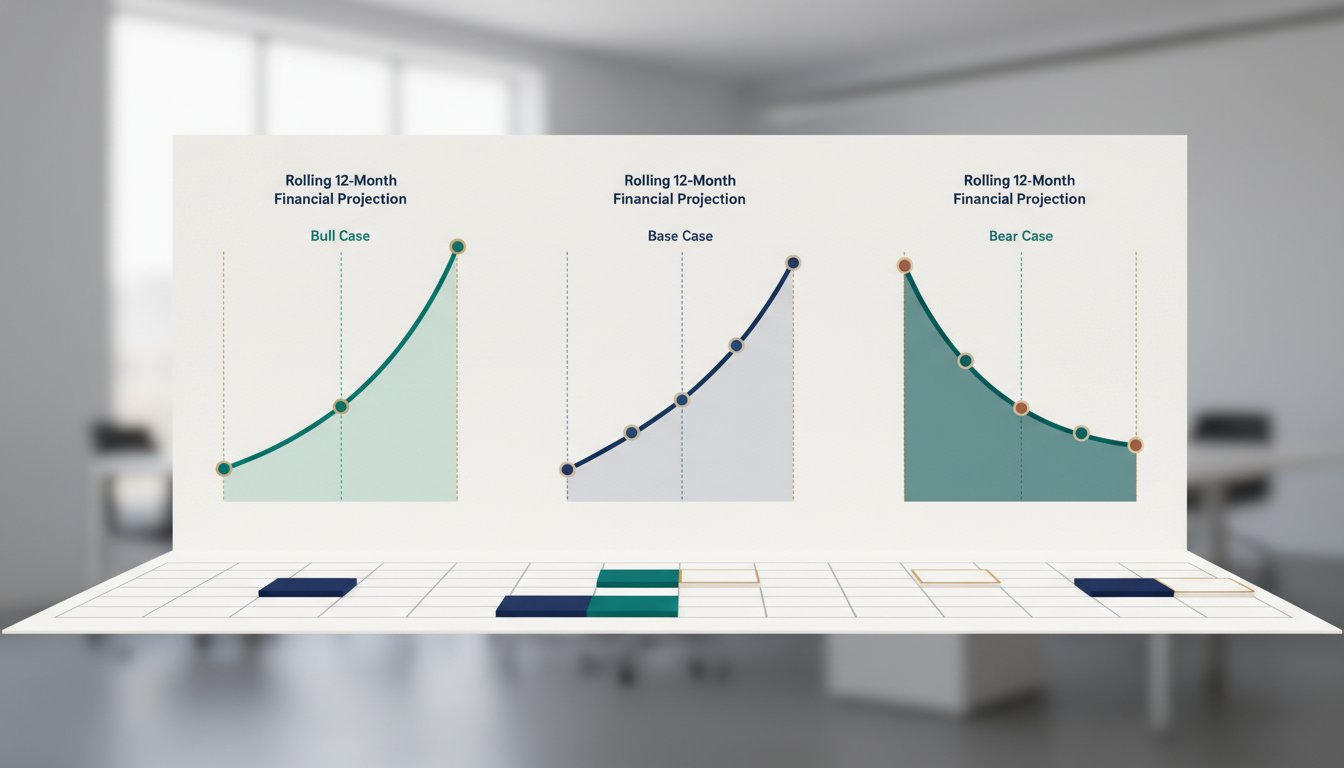
Investors evaluate hundreds of pitch decks per year, and a weak financial model is one of the fastest reasons for rejection. VCs expect founders to present 12-18 month financial projections with base, bull, and bear scenarios during fundraising.1 A static budget created once and never updated signals that a founder does not understand the dynamic nature of their own business.
The core problem is that 82% of small businesses fail due to cash flow mismanagement, yet most lack rolling forecasts to anticipate shortfalls.2 A rolling 12-month forecast updated monthly improves forecast accuracy by 30-40% compared to static annual budgets.3 For a founder preparing for a seed round, this accuracy gap can mean the difference between showing 14 months of runway versus 9 months — a critical distinction when the median time to raise a seed round in 2024 was 6-9 months.4
Each month, the founder compares actual results to the forecast, adjusts assumptions, and extends the model by one month. This process builds institutional knowledge about which drivers actually move the business. Only 35% of startups have a formal cash flow forecasting process in place before Series A.5 Founders who implement one gain a structural advantage in fundraising conversations.
Defining Your Scenario Variables and Key Drivers
A useful scenario model starts with the right variables. The most common mistake is building a top-down model that projects revenue from a single growth rate. Investor-grade models are driver-based: they connect operational inputs to financial outputs through explicit assumptions.
The key drivers fall into three categories. Revenue drivers include customer acquisition cost (CAC), monthly recurring revenue (MRR) growth rate, churn rate, and average revenue per account (ARPA). Cost drivers include headcount, salary bands, software subscriptions, and marketing spend. Cash flow drivers include payment terms, days sales outstanding (DSO), and capital expenditure timing.
| Driver Category | Example Variables | Impact on Projection |
|---|---|---|
| Revenue | MRR growth rate, churn, ARPA, CAC | Determines top-line trajectory and unit economics |
| Cost | Headcount, salary bands, marketing budget | Drives burn rate and breakeven timeline |
| Cash Flow | DSO, payment terms, CapEx timing | Determines runway and capital required |
For a hypothetical SaaS company with $500K ARR, the critical variable is not the overall growth rate but the relationship between CAC and customer lifetime value (LTV). Each scenario must be driven by changes to these underlying variables, not by arbitrary revenue multipliers.
Building the Base Case from Historical Financial Data
The base case is not a guess. It is an extrapolation of actual historical performance adjusted for known changes. Start with at least 12 months of historical monthly data: revenue by stream, cost of goods sold, operating expenses by department, and cash flow statements. This historical baseline anchors the projection in reality.
Build the model in three layers. First, project revenue using the historical growth rate and churn rate, then layer in known pipeline and contract renewals. Second, project costs based on current headcount and committed spending, then add planned hires and their start dates. Third, calculate cash flow by applying historical DSO and payment terms to projected revenue and expenses.
| Model Layer | Input Source | Output |
|---|---|---|
| Revenue | Historical MRR, churn, pipeline | Monthly revenue forecast |
| Costs | Headcount, vendor contracts, budget | Monthly expense forecast |
| Cash Flow | DSO, payment terms, CapEx | Monthly cash balance and runway |
A common error is projecting revenue growth without accounting for the cash cost of that growth. If a SaaS company grows MRR by, for example, 10% month over month, it must spend proportionally more on sales and marketing. The base case must include this feedback loop. For a business with $50K monthly burn and $300K in the bank, the base case should show exactly when cash reaches zero under current assumptions. That date is the fundraising deadline.
Creating Upside and Downside Scenario Versions
Each scenario must be driven by explicit changes to the underlying business variables. It should not assume the company captures a dominant share of the market — for example, a startup targeting SMBs might aim for 5–10% penetration in its first year, not the entire addressable market.
| Scenario | Revenue Growth | Churn Rate | CAC | Cash Runway |
|---|---|---|---|---|
| Bear | 3% monthly | 5% monthly | $8,000 | 9 months |
| Base | 6% monthly | 3% monthly | $5,000 | 14 months |
| Bull | 9% monthly | 2% monthly | $4,000 | 18 months |
The bear case is the most important scenario for fundraising. Investors want to know how much capital the company needs if everything goes wrong. If the bear case shows the company running out of cash in 9 months, the founder should raise enough to cover 18 months of the bear case burn rate. This is the standard calculation for determining the fundraising amount.
Each scenario must be internally consistent. If the bull case assumes faster revenue growth, it must also assume higher sales and marketing spend to achieve that growth. If the bear case assumes higher churn, it must also assume lower customer acquisition to reflect a damaged reputation. Inconsistent scenarios signal to investors that the founder does not understand their own business model.
Stress Testing Assumptions Against Real Market Conditions
A model is only as good as its assumptions. Stress testing means asking "what happens if" questions and verifying that the model produces plausible answers. For a startup targeting enterprise customers, test what happens if the sales cycle extends from 90 to 120 days. For a direct-to-consumer business, test what happens if customer acquisition costs rise significantly — for example, by 30% due to ad platform changes.
The most effective stress tests focus on the company's specific risk factors. A hardware startup should test component cost increases and shipping delays. A marketplace should test take rate compression and regulatory changes. A services business should test utilization rate drops and project delays.
Document every assumption and its source. If the bull case assumes churn drops to 2%, explain why — a new onboarding process, a product feature, or a pricing change. Investors will ask for this documentation during due diligence.
Fractional CFOs typically build 3-scenario models with 12-month rolling views as the standard deliverable for fundraising readiness.6 The stress testing process is where the model earns its credibility. A model that survives rigorous stress testing gives investors confidence that the founder has thought through the risks.
Presenting Rolling Projections to Investors and Board Members
The presentation of the model matters as much as the model itself. Investors do not want to see a spreadsheet with 50 tabs. They want a clear narrative: here is where we are, here is where we are going, and here is how much capital we need to get there.
Structure the presentation around three exhibits. First, a one-page summary showing the three scenarios side by side with key metrics: revenue at month 12, cash runway, and total capital required. Second, a detailed view of the base case with monthly revenue, expenses, and cash balance. Third, a sensitivity table showing how changes in two key drivers affect runway.
| Metric | Bear | Base | Bull |
|---|---|---|---|
| Month 12 ARR | $750K | $1.2M | $1.8M |
| Cash Runway | 9 months | 14 months | 18 months |
| Capital Required | $1.5M | $1.0M | $800K |
When presenting, lead with the base case and explain the key drivers. Then show the bull case as upside potential and the bear case as risk mitigation. Investors will focus on the bear case — they want to know that the founder has planned for the worst. Be prepared to explain what triggers would move the company from the base case to the bear case and what actions would be taken in response.
Maintaining and Updating Projections as New Data Arrives
A rolling projection is not a one-time document. It must be updated monthly as actual results come in. Each month, replace the forecasted numbers for the completed month with actuals, then extend the projection by one month. This keeps the model at a constant 12-month horizon.
The monthly update process has three steps. First, enter actual revenue, expenses, and cash flow for the completed month. Second, compare actuals to the forecast and calculate variance. Third, adjust forward-looking assumptions based on the variance and any new information about the business.
If actual revenue was significantly below forecast — for example, 10% lower — do not simply adjust the growth rate downward. Investigate why. Was it a one-time event or a trend? If a key customer churned, adjust the churn rate assumption. If a sales rep underperformed, adjust the hiring timeline or ramp time assumption. The model should reflect the most current understanding of the business.
A rolling 12-month forecast updated monthly improves forecast accuracy by 30-40% compared to static annual budgets.3 This improvement compounds over time. After six months of monthly updates, the model becomes a reliable tool for decision-making, not just a fundraising artifact.
Your Next Step
Open your current financial model and check whether it includes a rolling 12-month view with three scenarios. If it does not, start by pulling the last 12 months of actual monthly data into a spreadsheet. Build the base case first using your historical growth rate and current cost structure. Then create the bear case by increasing churn by 2 percentage points and extending the sales cycle by 30 days. If you need help building an investor-grade scenario model, reach out to [email protected].
Footnotes
-
https://www.ycombinator.com/library/4Q-how-to-build-your-financial-model ↩ ↩2
-
https://www.usbank.com/business-banking/checking/cash-flow-management.html ↩
-
https://budgyt.com/insights/how-to-build-a-rolling-forecast ↩ ↩2 ↩3
-
https://afpglobal.org/news/fundraising-effectiveness-project-data-q1-2025-shows-increases-dollars-raised-declining ↩
-
https://www.phoenixstrategy.group/blog/5-steps-to-build-rolling-forecast-models ↩ ↩2
-
https://spitzcpa.com/example-of-cash-flow-projection-for-12-months ↩ ↩2