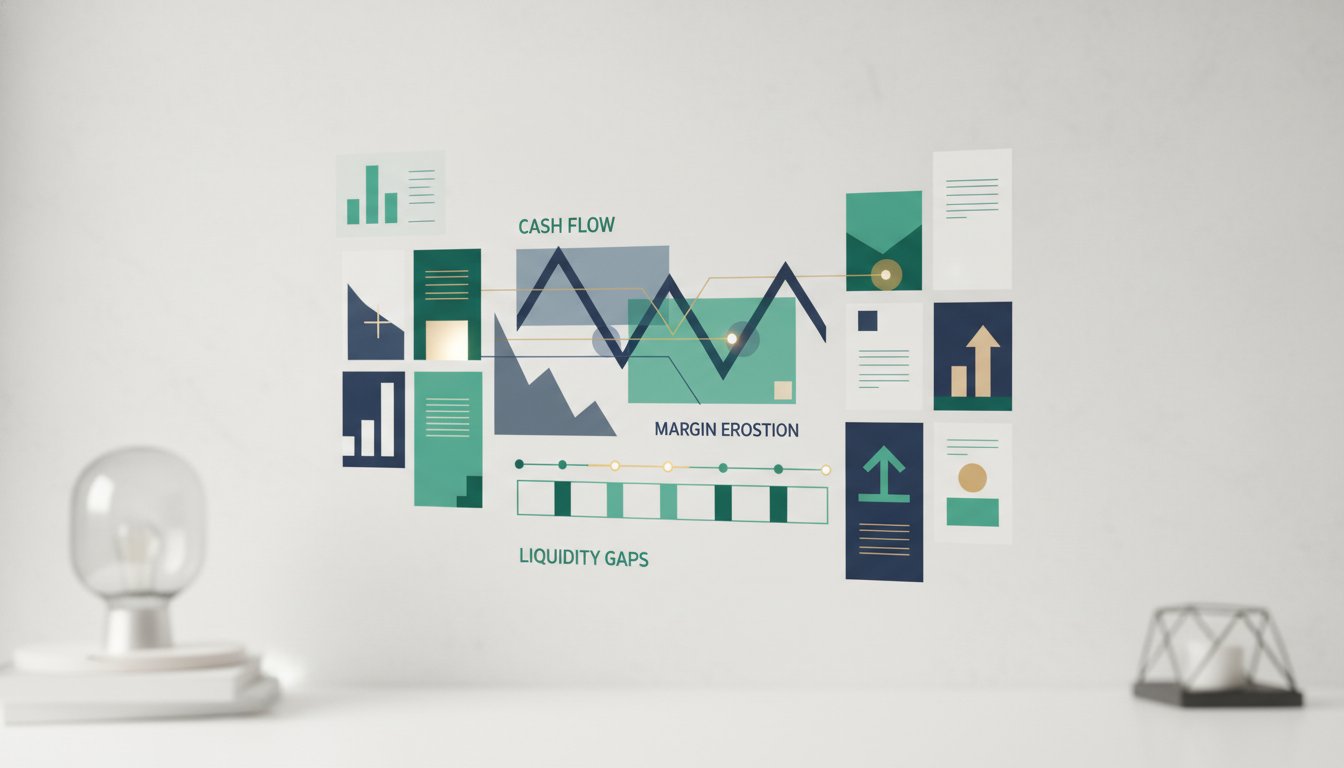
Why Operating Cash Flow Reveals Margin Erosion Before Net Income Does
Operating cash flow analysis is the process of examining the cash generated from a company's core business operations to assess financial health, operational efficiency, and liquidity risk. It focuses exclusively on the cash impact of producing and selling goods or services, excluding investing and financing activities.
Net income includes non-cash items like depreciation, amortization, and accrued revenue that can mask deteriorating margins. Operating cash flow strips those away, showing only the actual cash moving in and out of operations. When a business books a sale on net-60 terms, net income records the revenue immediately, but operating cash flow waits until the cash hits the bank account.
A declining operating cash flow relative to sales is often the first measurable signal that margins are compressing. Consider a hypothetical manufacturer with $2 million in annual revenue. If its operating cash flow drops from $300,000 to $180,000 while revenue stays flat, the business has lost $120,000 in cash-generating capacity — even if net income shows only a $40,000 decline.1
The U.S. Bank study found that 82% of small businesses fail due to cash flow mismanagement.2 Many of those failures were preceded by months of declining operating cash flow that net income statements never flagged. By the time net income turned negative, the cash position was already critical.
The Difference Between Profit and Operating Cash Flow
Profit and operating cash flow measure different things. Profit (net income) is an accounting construct that matches revenue to expenses under GAAP accrual rules. Operating cash flow is a cash-basis measure that counts only money received and spent.
| Metric | What It Measures | Non-Cash Items Included |
|---|---|---|
| Net Income | Accounting profit after all expenses | Depreciation, amortization, accrued revenue, deferred taxes |
| Operating Cash Flow | Cash generated from core business operations | None — only actual cash inflows and outflows |
A typical SMB scenario illustrates the divergence. Suppose a service business signs a $100,000 annual contract in December, invoices the client, and records the revenue. Net income shows the full $100,0002. But if the client pays on net-60 terms, operating cash flow records zero cash from that contract in December. The business may show a profitable quarter while its bank account drains to pay salaries and rent.
GAAP requires companies to classify cash flows into operating, investing, and financing activities on the cash flow statement.3 Operating cash flow sits at the top of that statement and is the most direct measure of whether a business can sustain itself without outside capital.
How to Calculate Operating Cash Flow from Your Financial Statements
Operating cash flow appears directly on the cash flow statement, but many SMB owners never look past the income statement. The calculation starts with net income and adjusts for non-cash items and changes in working capital.
The formula is straightforward:
Operating Cash Flow = Net Income + Non-Cash Expenses (Depreciation, Amortization) + Changes in Working Capital
Working capital changes include increases or decreases in accounts receivable, accounts payable, and inventory. An increase in accounts receivable reduces operating cash flow because cash hasn't been collected yet. An increase in accounts payable increases operating cash flow because the business is holding onto cash longer.
| Adjustment | Effect on Operating Cash Flow |
|---|---|
| Depreciation added back | Increases OCF |
| Accounts receivable increase | Decreases OCF |
| Accounts payable increase | Increases OCF |
| Inventory increase | Decreases OCF |
For a business with $500,000 in net income, $50,000 in depreciation, a $30,000 increase in receivables, and a $20,000 increase in payables, operating cash flow would be $540,000 ($500,000 + $50,000 - $30,000 + $20,000). If that same business had a $100,000 increase in receivables instead, operating cash flow would drop to $470,000 — a $70,000 swing driven entirely by collection timing.
Three Early Warning Signs of Margin Erosion in Operating Cash Flow
1. Operating Cash Flow Growing Slower Than Revenue
When revenue increases significantly but operating cash flow grows by only a fraction of that amount, the business is spending more to generate each dollar of sales. This pattern often precedes a full margin collapse. For a retailer with $3 million in revenue, a 15% revenue increase should produce a proportional or better cash flow increase. If it doesn't, costs are rising faster than pricing can compensate.
2. Operating Cash Flow Turning Negative While Net Income Stays Positive
This is the most dangerous signal. A business showing, for example, $200,000 in net income but negative operating cash flow is consuming cash to operate. The gap typically comes from rapid receivables growth, inventory buildup, or both. The business is profitable on paper but bleeding cash in practice.
3. Operating Cash Flow Declining for Three Consecutive Months
A single month of weak operating cash flow can result from timing — a large client paying late, for example. Three consecutive months of decline indicates a structural problem. The business may be discounting to win sales, losing pricing power, or facing rising input costs it cannot pass through.
Why Revenue Growth Can Mask a Liquidity Gap
Revenue growth is the most celebrated metric in small business, but it can hide a deteriorating cash position. When a business grows quickly, it often extends credit to new customers, builds inventory, and hires ahead of revenue. Each of those actions consumes cash.
Consider a hypothetical SaaS company adding $100,000 in monthly recurring revenue. If customers pay monthly but the business pays annual software licensing fees upfront, operating cash flow may be negative for six months while net income shows steady growth. The liquidity gap widens with every new customer.
The average SMB holds only 27 days of cash reserves.4 A business growing at 20% per quarter can exhaust those reserves in two months if operating cash flow doesn't keep pace. Revenue growth creates the illusion of health while the cash account quietly drains.
The SBA recommends maintaining six months of operating expense reserves for liquidity safety.5 Few growing businesses meet that standard. The gap between revenue growth and operating cash flow growth is where liquidity crises form.
Using Operating Cash Flow Trends to Diagnose Cost Structure Problems
Operating cash flow trends reveal whether cost structure problems are temporary or permanent. A one-month dip from a large client paying late is a timing issue. A six-month decline while revenue holds steady signals a structural cost problem.
The diagnostic approach compares operating cash flow to revenue over rolling three-month periods. If operating cash flow as a percentage of revenue drops by five percentage points over two quarters — for example, from 15% to 10% — the business has lost one-third of its cash-generating efficiency. The cause could be rising material costs, increased labor expenses, or pricing pressure from competitors.
For a typical manufacturer with $5 million in revenue, a five-percentage-point drop in operating cash flow margin represents $250,000 in lost cash annually. That amount would cover two full-time employees or fund a year of equipment maintenance. The loss compounds if the business borrows to cover the gap, adding interest expense to the cost structure.
The Operating Cash Flow Ratio Every SMB Owner Should Track Monthly
The operating cash flow ratio measures how many times operating cash flow covers current liabilities. It is calculated as:
Operating Cash Flow Ratio = Operating Cash Flow / Current Liabilities
A ratio above 1.0 means the business generates enough cash from operations to pay its short-term obligations. A ratio below 1.0 means the business must rely on reserves, borrowing, or equity to meet current liabilities.
| Operating Cash Flow Ratio | Interpretation |
|---|---|
| Above 1.5 | Strong liquidity position |
| 1.0 to 1.5 | Adequate but monitor closely |
| 0.5 to 1.0 | Warning — liquidity gap forming |
| Below 0.5 | Critical — cash crisis imminent |
For a business with $400,000 in annual operating cash flow and $350,000 in current liabilities, the ratio is 1.14. That is adequate but leaves little room for error. A single large client paying 30 days late could push the ratio below 1.0.
Tracking this ratio monthly creates an early warning system. A declining trend over three months triggers a review of receivables aging, payment terms, and expense structure before the business needs emergency financing.
How Fractional CFOs Use Operating Cash Flow Analysis to Prevent Cash Crises
Fractional CFOs apply operating cash flow analysis as a diagnostic tool, not a reporting exercise. They build rolling 13-week cash flow forecasts that project operating cash flow based on actual receivables aging, payment terms, and expense commitments. The forecast flags liquidity gaps 30 to 60 days before they materialize.
The three-line liquidity gap test is a standard diagnostic. It compares operating cash flow, free cash flow, and total cash reserves on a single timeline. When operating cash flow turns negative, free cash flow typically follows within one month, and total reserves deplete within two to three months depending on the burn rate.
For a business with $2 million in revenue and thin margins, a 13-week forecast might show operating cash flow turning negative in week six, free cash flow negative in week eight, and cash reserves exhausted by week twelve. That timeline gives the business owner eight weeks to adjust pricing, cut costs, or arrange financing.
The SBA recommends maintaining six months of operating expense reserves.5 Fractional CFOs use operating cash flow analysis to determine whether a business meets that standard and, if not, to build a plan to get there.
Your Next Step
Pull your most recent cash flow statement and calculate your operating cash flow ratio. Divide operating cash flow by current liabilities. If the result is below 1.0, build a 13-week cash flow forecast this week — not next month. Identify the three largest receivables and call each client to confirm payment dates. If the ratio is above 1.5, set a monthly calendar reminder to recalculate it. The businesses that survive cash flow crises are the ones that see them coming. For a free operating cash flow analysis template, email [email protected].
Footnotes
-
https://www.fathomhq.com/blog/understanding-cash-flow-analysis ↩
-
https://www.usbank.com/financialiq/improve-your-business/operations-and-management/cash-flow-management.html ↩ ↩2
-
https://www.investopedia.com/investing/what-is-a-cash-flow-statement ↩
-
https://www.jpmorgan.com/insights/global-research/small-business/cash-buffer ↩
-
https://www.sba.gov/business-guide/manage-your-business/manage-cash-flow ↩ ↩2