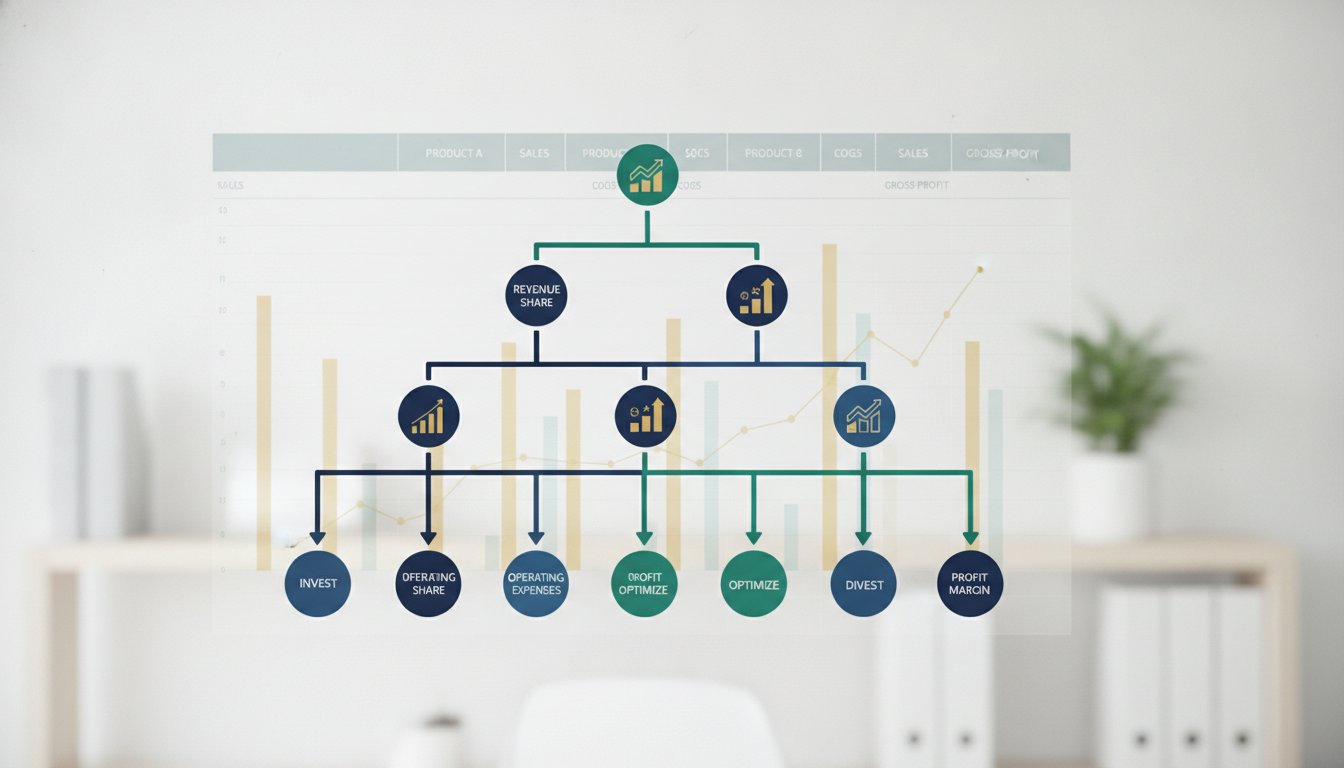
A product line break-even analysis is a diagnostic method that calculates the sales volume each product line needs to cover its direct costs and allocated fixed costs. Revenue up 20% year over year. Costs flat. Yet net profit is shrinking. This pattern confuses founders because standard accounting reports don't show which products actually generate profit after covering their share of overhead.
Why Growing Revenue Can Mask Shrinking Margins
Revenue up 20% year over year. Costs flat. Yet net profit is shrinking. This pattern confuses founders because standard accounting reports don't show which products actually generate profit after covering their share of overhead. A product line break-even analysis is the diagnostic tool that isolates each offering's true contribution by calculating the sales volume required for that line to cover its direct costs and allocated fixed costs.
Revenue growth creates a powerful optical illusion. When total sales increase, the natural assumption is that the business is healthier. But revenue is not profit, and aggregate numbers hide product-level dynamics.
Consider a hypothetical retailer with three product lines. Line A generates $200K in revenue with a 60% gross margin1. Line B generates $300K with a 35% gross margin2. Line C generates $500K with a 15% gross margin3. The blended gross margin is roughly 30%, which looks acceptable. But when allocated overhead — rent, insurance, management salaries — is distributed proportionally, Line C may be losing money on every unit sold. The revenue from Line C inflates the top line while the hidden costs erode net profit.
The problem is structural. Most SMB income statements are organized by expense category, not by product line. A founder sees rising rent and payroll costs but cannot trace them to specific offerings. Without a product line break-even analysis, the business continues selling more of what loses money, mistaking volume for success.
The Hidden Cost of Carrying Underperforming Products
Underperforming products do not just fail to contribute profit — they actively consume resources that profitable lines could use. Inventory carrying costs, warehouse space, customer support time, and marketing spend all get diverted to products that generate insufficient margin.
1 The cash drain is subtle. A product that sells steadily but at a thin contribution margin after allocated overhead requires enormous volume just to break even. Meanwhile, the cash tied up in its inventory could have funded growth for a higher-margin line.
The opportunity cost compounds. Every hour a salesperson spends pushing a low-margin product is an hour not spent on a profitable one. Every dollar of marketing budget allocated to a loss leader is a dollar not generating returns elsewhere. Hidden loss leaders create a drag that slows the entire business.
How to Calculate True Profitability Per Product Line
True profitability requires building a product-line P&L. The formula is straightforward but requires discipline to execute.
Start with revenue per product line. Subtract direct costs — materials, labor, shipping, and any variable costs that scale with each unit sold. This yields the gross margin per line.
Next, allocate fixed costs. Some fixed costs are directly traceable: a dedicated production line, a product-specific software subscription, or a salesperson who sells only that product. Other fixed costs — rent, utilities, executive salaries — must be allocated using a reasonable basis. Common allocation methods include percentage of revenue, percentage of square footage, or percentage of labor hours.
The result is the net profit or loss per product line. A product that shows positive gross margin but negative net profit after allocation is a hidden loss leader. The CurrentCFO product line profitability framework provides a practical method to identify which lines drive margin versus those that drain it.2
Three Red Flags Your Product Line Is Draining Cash
1. Revenue grows but gross margin percentage declines. If total revenue is increasing but the blended gross margin is falling, at least one product line is growing faster than its margin justifies. This is the most common early warning sign.
2. Inventory turnover slows for a specific line. A product that sits in inventory longer than the company average ties up cash and incurs carrying costs. For a retailer, carrying costs typically run 20-30% of inventory value annually. A slow-moving product may be consuming more in carrying costs than it generates in margin.
3. Customer support requests cluster around one product. If one product generates a disproportionate share of support tickets, the cost of serving those customers may exceed the product's contribution. Support costs are real and should be allocated to the product line that causes them.
Mapping Fixed and Variable Costs to Individual Products
Cost mapping is the most labor-intensive step and the one most SMBs skip. Without accurate cost allocation, the analysis is meaningless.
Variable costs are straightforward: materials, direct labor, packaging, shipping, and sales commissions. These scale with each unit sold.
Fixed costs require judgment. The goal is to assign each fixed cost to the product line that causes it. A shared warehouse might be allocated by cubic footage occupied. A CEO's salary might be allocated by time spent on each product line, estimated through a simple time log over two weeks.
| Cost Category | Allocation Basis | Example |
|---|---|---|
| Rent | Square footage per product line | 40% of warehouse used for Product A |
| Insurance | Revenue percentage | Product B generates 30% of revenue, gets 30% of insurance |
| Management salary | Time log estimate | CEO spends 20% of time on Product C |
| Marketing | Campaign attribution | Product A ads cost $5K/month directly |
The table above shows how to map common fixed costs. The allocation does not need to be perfect — it needs to be reasonable and consistent. A product that shows negative net profit under a reasonable allocation is almost certainly a loss leader.
Using Break-Even Analysis to Set Minimum Order Quantities
Break-even analysis transforms cost data into actionable thresholds. The formula is precise: Break-Even Units = Total Fixed Costs ÷ Contribution Margin per Unit.3
Contribution margin per unit is the selling price minus all variable costs per unit. Total fixed costs include all allocated overhead for that product line. The result is the number of units the business must sell each period just to cover costs.
For a hypothetical product with $50 selling price, $30 variable costs, and $10,000 in monthly allocated fixed costs, the break-even is 500 units per month. If the business sells 400 units, the product loses $2,000 per month. If it sells 600 units, it profits $2,000 per month.
This analysis sets a floor for minimum order quantities. If a customer wants a custom run of 200 units but the break-even is 500, the business should either decline the order or raise the price to compensate for the volume shortfall. The break-even analysis multiple product lines approach allows a founder to set different minimums for each line based on its cost structure.
When to Kill a Product vs When to Fix the Pricing
Not every loss leader should be eliminated. Some serve strategic purposes — Costco's $1.50 hot dog combo is a famous intentional loss leader that drives store traffic and overall profitability.4 The decision depends on the product's role in the business.
Kill a product if: it has no strategic value, it consumes disproportionate management time, and its customers do not buy profitable products. A product that loses money and generates no cross-sales is a pure drain.
Fix pricing if: the product has strategic value, customers are price-insensitive, or the loss is caused by cost increases that have not been passed through.
The decision framework is simple. Map each product line on a 2x2 grid: strategic importance on one axis, profitability on the other. Products that are strategically important and unprofitable need pricing fixes. Products that are strategically unimportant and unprofitable should be killed. Products that are strategically important and profitable should be protected and grown.
Building a Quarterly Product Line Review Cadence
A single analysis is a snapshot. Profitability changes as costs shift, prices change, and product mix evolves. A quarterly review cadence ensures the business catches problems early.
The review process takes one day per quarter. Pull the last three months of revenue and cost data by product line. Update the cost allocations if any fixed costs have changed significantly. Recalculate break-even points. Compare actual sales to break-even thresholds.
| Quarter | Product A Profit | Product B Profit | Product C Profit |
|---|---|---|---|
| Q1 | +$12,000 | -$3,000 | +$8,000 |
| Q2 | +$11,500 | -$4,200 | +$7,500 |
| Q3 | +$10,000 | -$5,800 | +$6,000 |
| Q4 | +$9,000 | -$7,000 | +$5,000 |
The table above shows a hypothetical product line trending toward trouble. Product B's losses are growing each quarter. Without a quarterly review, the founder might not notice until the losses have compounded significantly.
The review also creates accountability. Product managers or sales leads should present their line's profitability and explain any negative trends. The discipline of regular review prevents small problems from becoming large ones.
Your Next Step
For a template spreadsheet that automates this analysis, email [email protected].
Footnotes
-
https://www.usbank.com/financialiq/improve-your-business/operations-and-management/why-do-small-businesses-fail.html ↩ ↩2
-
https://currentcfo.com/blog/product-line-profitability-analysis-framework-smb ↩ ↩2
-
https://wiss.com/break-even-analysis-for-manufacturing-cfos ↩ ↩2
-
https://medium.com/@rudyadrian/the-power-of-cheap-what-we-can-learn-about-loss-leader-product-8858be29ce27 ↩ ↩2