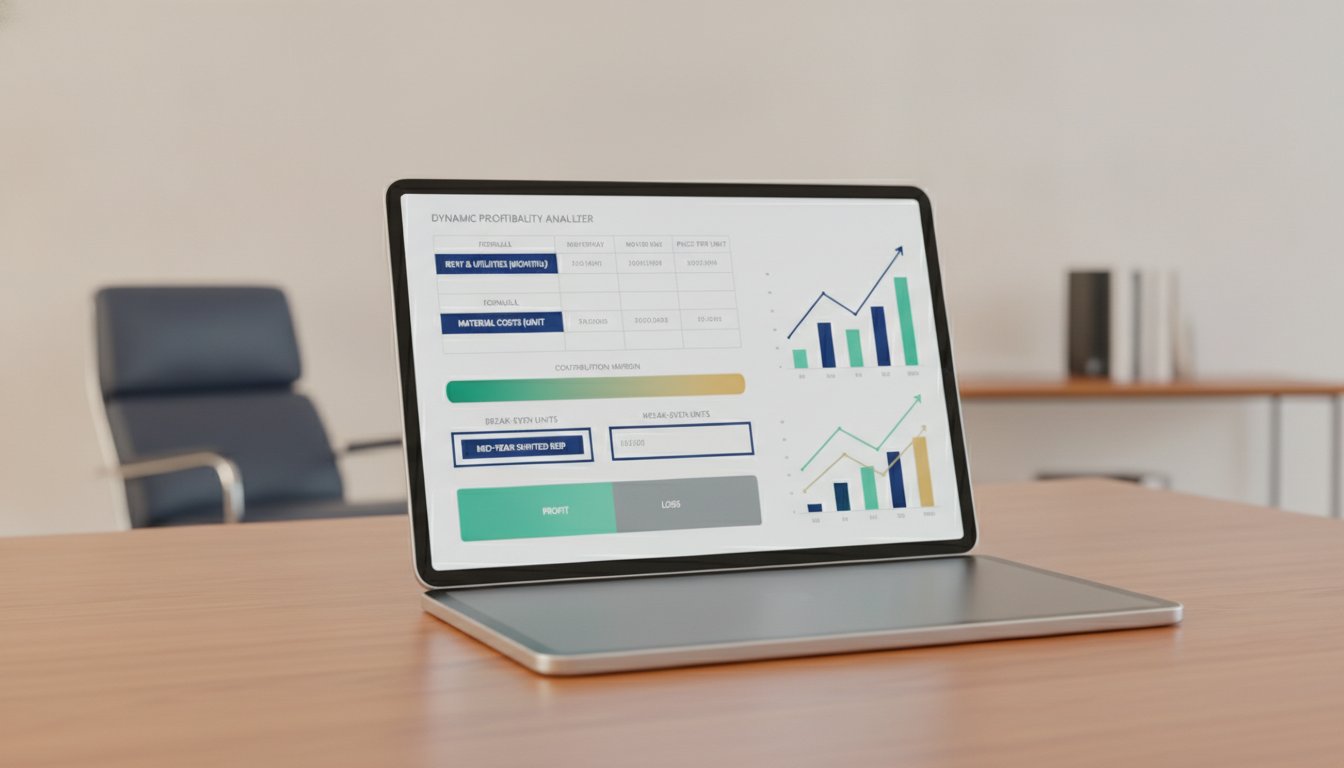
Why Static Break-Even Fails When Costs Shift Mid-Year
A dynamic break-even analysis small business is a financial model that recalculates the profitability threshold whenever costs change, rather than treating the break-even point as a fixed number set once per year. For SMB owners managing $1M-$10M in revenue, mid-year cost shifts in COGS, labor, or overhead can silently erode margins unless the break-even point is recalculated with each change.
The standard break-even formula — fixed costs divided by contribution margin per unit — assumes costs remain stable throughout the year.1 That assumption breaks down the moment a supplier raises prices, a key employee gets a raise, or rent increases at renewal.
Consider a hypothetical retailer with $2M in annual revenue. Their original break-even calculation assumed COGS at 55% of revenue and fixed overhead at $600,000.2 In March, their primary supplier increases material costs by 8% — a typical mid-year shift. The static break-even model still shows the old threshold, but the actual break-even point has already moved upward by roughly $60,000 in required revenue.
3 A static break-even model that does not update with cost changes is not just inaccurate — it is a liability. Owners making hiring or pricing decisions based on outdated numbers risk approving expenditures that the current margin structure cannot support.
A dynamic model solves this by linking each cost input to a live recalculation. When any variable changes, the break-even output updates immediately. This allows owners to see the real-time impact of a rent increase or a COGS jump before those costs hit the bank account.
When Your Break-Even Point Shifts Mid-Year: The Problem
Mid-year cost changes arrive without warning. A landlord notifies you of a rent increase effective July 1. A key supplier emails that raw material prices are rising next month. Your best employee asks for a $15,000 salary adjustment.
Each of these events changes the break-even point. Without a recalculation, the owner cannot answer three critical questions: How much additional revenue is needed to cover this cost? Can the current pricing absorb it? Or must spending be cut elsewhere?
For a business with $3M in annual revenue and a 40% gross margin, a $30,000 annual rent increase requires roughly $75,000 in new revenue just to maintain the same profit level. If the owner does not recalculate, that $30,000 flows straight to the bottom line as lost profit.
The problem compounds when multiple cost shifts happen in the same quarter. A COGS increase in April, a salary adjustment in June, and a rent hike in July create a cumulative effect that a single static model cannot capture. The owner sees declining bank balances but cannot pinpoint which cost change pushed the business past the profitability threshold.
Building a Dynamic Break-Even Worksheet in Google Sheets
A dynamic break-even worksheet requires three input sections and one output section. The structure is straightforward enough for any owner to build in under an hour.
Input Section 1: Fixed Costs. List every fixed monthly expense — rent, salaries, insurance, software subscriptions, loan payments. Total these into a monthly fixed cost figure. For annual costs, divide by 12.
Input Section 2: Variable Costs Per Unit. For product businesses, this is COGS per unit. For service businesses, estimate variable cost per billable hour or per client. Include materials, direct labor, shipping, and payment processing fees.
Input Section 3: Selling Price Per Unit. The average revenue per unit sold or per service delivered.
Output Section: Break-Even Quantity. The formula is simple: Total Fixed Costs ÷ (Selling Price Per Unit − Variable Cost Per Unit). The result is the number of units needed to break even each month.
| Input Category | Example Value | Notes |
|---|---|---|
| Monthly Fixed Costs | $50,000 | Rent, salaries, insurance, software |
| Variable Cost Per Unit | $25 | COGS + direct labor + shipping |
| Selling Price Per Unit | $75 | Average revenue per unit |
| Break-Even Units | 1,000 units/month | $50,000 ÷ ($75 − $25) |
The key to making this dynamic is linking every input cell to a master calculation cell. When rent changes, update the fixed cost cell. When COGS changes, update the variable cost cell. The break-even output recalculates instantly.
How to Recalculate Fixed Costs After a Rent or Salary Change
Fixed costs are not truly fixed over a 12-month period. Rent renews, salaries adjust, and insurance premiums change. Each adjustment requires a recalculation of the break-even point.
When rent increases, update the fixed cost total in the worksheet. Suppose monthly rent rises from $8,000 to $9,500 — an increase of $1,500. With a contribution margin of, say, $50 per unit, the break-even quantity rises by 30 units per month. That is 30 additional units the business must sell just to cover the rent increase.
Salary changes follow the same logic. If an employee receives a $10,000 annual raise, that adds roughly $833 per month to fixed costs. At a $50 contribution margin, the break-even point rises by 17 units per month. The owner must decide whether to absorb this through higher volume, a price increase, or a cost reduction elsewhere.
| Cost Change | Monthly Impact | Additional Units Needed (at $50 margin) |
|---|---|---|
| Rent +$1,500/mo | +$1,500 | 30 units |
| Salary +$10,000/yr | +$833 | 17 units |
| Insurance +$3,000/yr | +$250 | 5 units |
The worksheet should include a "scenario input" row where the owner can type a proposed cost change and see the new break-even quantity immediately. This turns the model from a static report into a decision-making tool.
Variable Cost Creep: Spotting It Before It Hits Margins
Variable cost creep is harder to catch than fixed cost changes because it happens incrementally. For example, a supplier raises prices by 3% in January, another 2% in April, and a third supplier adds a fuel surcharge in July. Each increase is small enough to ignore individually, but the cumulative effect can shrink contribution margin by 10% or more over a year.1
The dynamic worksheet catches this by tracking variable cost per unit over time. Enter the current COGS per unit in the input cell. When a supplier notifies you of a price increase, update the cell immediately. The break-even output changes by the full amount of the cost increase, not just the incremental portion.
For a hypothetical manufacturer selling a product at $100 with variable costs of $60, the contribution margin is $40. If variable costs creep to $66 over six months, the contribution margin drops to $34 — a 15% reduction. The break-even quantity rises from 1,250 units to 1,471 units, assuming fixed costs of $50,000.
| Period | Variable Cost/Unit | Contribution Margin | Break-Even Units |
|---|---|---|---|
| January | $60 | $40 | 1,250 |
| March | $62 | $38 | 1,316 |
| June | $66 | $34 | 1,471 |
The worksheet should include a variable cost history table so the owner can see the trend. A 2% increase in one month is easy to dismiss. A 10% increase over six months demands action.
Running the Recalculation: A Step-by-Step Walkthrough
Step 1: Gather current cost data. Pull the most recent month's P&L. Identify every fixed cost line item and every variable cost per unit. Do not estimate — use actual numbers from the accounting system.
Step 2: Enter fixed costs into the worksheet. Sum all monthly fixed expenses. Include rent, salaries, insurance, loan payments, software subscriptions, and any other recurring cost that does not vary with sales volume.
Step 3: Calculate variable cost per unit. Divide total variable costs for the month by total units sold. For a service business, divide by billable hours or client count. This gives the current variable cost per unit.
Step 4: Enter selling price per unit. Use the average revenue per unit for the most recent quarter. If prices vary by product line, calculate a weighted average.
Step 5: Read the break-even output. The worksheet displays the number of units needed to break even each month. Compare this to actual monthly sales volume. If actual volume is below the break-even point, the business is operating at a loss.
Step 6: Run scenarios. Change one input at a time. What happens if COGS rises 5%? What if rent increases $2,000? What if you raise prices 8%? Each scenario shows the new break-even quantity instantly.
Using the Output to Adjust Pricing or Spending Targets
The dynamic break-even output provides a clear decision framework. If the recalculated break-even point exceeds current sales volume, the owner has three options: raise prices, reduce costs, or increase volume.
Pricing adjustments. If the break-even quantity rises by 100 units per month and current volume cannot support that increase, a price increase may be necessary. The worksheet can model the effect: a typical 5% price increase raises contribution margin and lowers the break-even quantity. The owner can test different price points before implementing any change.
Spending targets. The worksheet also works in reverse. Suppose the owner wants to hire a new employee at $60,000 per year — enter $5,000 as a monthly fixed cost increase. The worksheet shows how many additional units must be sold to cover that hire. If the number is unrealistic, the hire must wait or be structured as a variable cost (commission-based).
Profit target integration. Add a profit target row to the worksheet. Instead of calculating break-even at zero profit, calculate the units needed to achieve a $10,000 monthly profit. This turns the model from a survival tool into a growth planning tool.
Your Next Step
Open Google Sheets and build the three-input worksheet described in this post. Enter your current fixed costs, variable cost per unit, and average selling price. Run the recalculation. If the break-even quantity is within 10% of your current monthly sales volume, run three scenarios: a 5% COGS increase, a 5% price increase, and a $2,000 monthly fixed cost increase. Each scenario will show you exactly how much margin you have before a cost shift pushes you into a loss.
For a template version of this worksheet with pre-built scenario inputs, reach out to the CurrentCFO team at [email protected].