The Silent Margin Drain: Why 10% of Your Customers Are Killing Profits
Customer profitability analysis small business is the process of measuring the true net profit generated by each customer after accounting for every cost incurred to serve them, not just the gross margin on their invoices. Most SMB owners track top-line revenue and assume that if a customer pays on time, the relationship is healthy. That assumption is often wrong.
A Harvard Business School study found that 20% of customers are highly profitable, 70% are neutral, and 10% are extremely unprofitable.1 For a small business with 50 customers, that means five clients are actively destroying the margins generated by the other 45. The problem is that most owners cannot name which five.
The damage is not theoretical. 82% of small businesses fail due to cash flow problems, and unprofitable customer contracts are a primary cause.2 When a contract requires excessive support hours, generates frequent returns, or demands custom work outside the original scope, the cost-to-serve silently rises. Revenue stays flat, but profit per customer drops. Over six to twelve months, the cumulative effect can erase an entire quarter's net income.
Small businesses generate 43.5% of US GDP and employ 45.9% of private sector workers, yet most lack the CFO-level margin analysis needed to catch this drain.3 The result is a business that looks busy, feels stressful, and earns less than it should.
The Warning Signs Your Small Business Has Unprofitable Contracts
Three indicators signal that a customer profitability analysis small business is overdue. First, the customer's support ticket volume is disproportionately high relative to their revenue. Suppose a client paying $2,000 per month generates more support requests than three clients paying $5,000 each — the math does not work.
Second, the customer consistently requests scope creep without paying for it. A typical pattern: the contract specifies two revisions, but the client demands five. The owner absorbs the extra hours to keep the relationship, and margin disappears.
Third, the customer generates excessive returns or chargebacks. Unprofitable customers often exhibit abusive behavior to support teams and generate excessive returns, draining resources that could serve better clients.4 For a retailer, a customer who returns 40% of orders is costing more in shipping, restocking, and customer service than their gross margin covers.
If any of these patterns exist, the next step is to build a structured diagnosis tree.
Building Your Customer Profitability Analysis Tree Step by Step
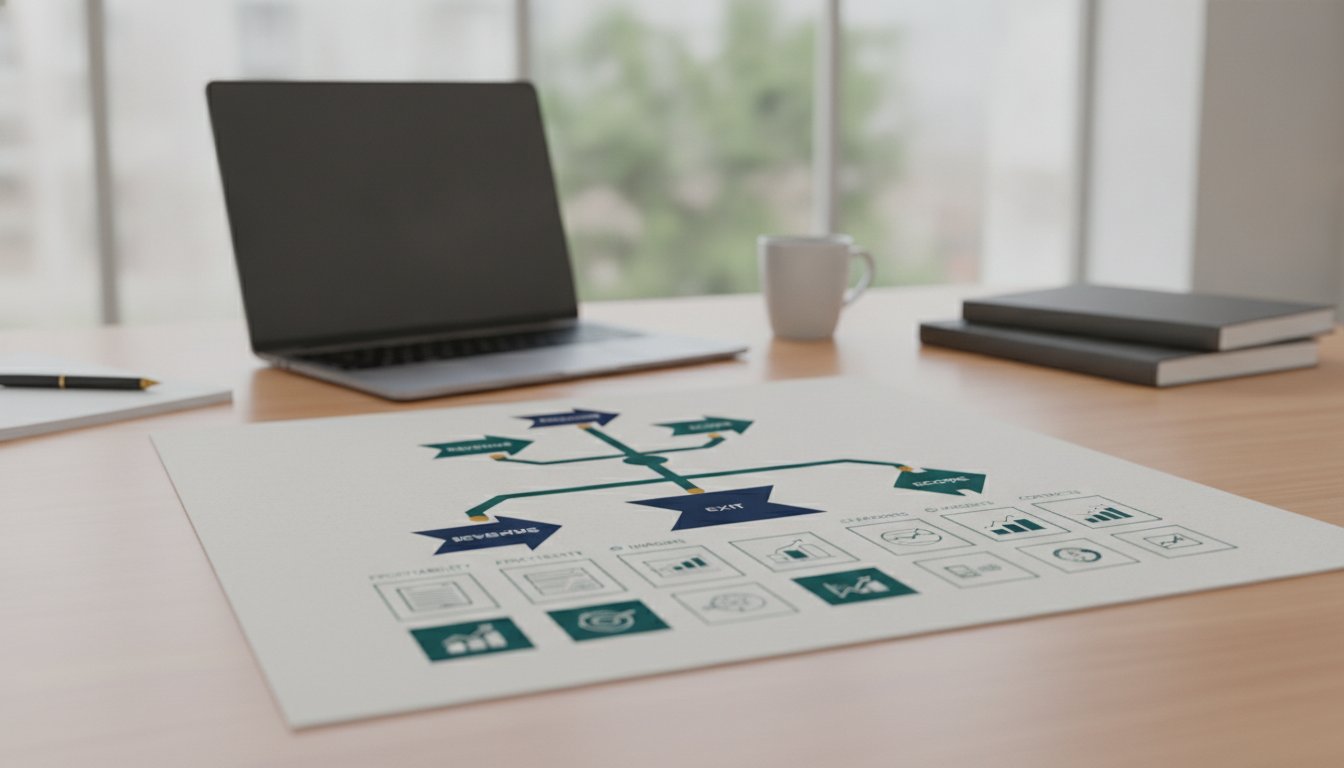
A customer profitability analysis tree is a decision framework that sorts customers into three buckets: profitable, break-even, and unprofitable. The tree has three branches: revenue tier, cost-to-serve ratio, and strategic value.
Start by listing every customer who generated more than a certain revenue threshold over the past twelve months — for example, $5,000. For a business with 30 customers, this might be 15 accounts. These are the only ones worth analyzing in detail. Customers below that threshold can be grouped into a single "small accounts" category.
For each customer in the list, calculate two numbers: total revenue received and total hours spent. Hours include sales time, onboarding, account management, support, and any custom work. Multiply total hours by the fully loaded hourly cost of the team members involved. For example, if a customer required 100 hours of support at a blended rate of $75 per hour, the cost-to-serve is $7,500.
Compare that cost to the revenue. If the cost-to-serve exceeds 40% of revenue, the customer is a candidate for the unprofitable bucket2. If it falls between a typical 25% and 40%, the customer is break-even. Below 25%, the customer is profitable1.
How to Calculate True Cost-to-Serve Per Customer
The cost-to-serve calculation requires four data points: direct labor hours, material or product costs, overhead allocation, and special handling costs. Most SMBs track the first two but ignore the last two.
Direct labor hours are the easiest. Pull time logs, support tickets, and project management data for each customer. Sum the hours across all departments. For a hypothetical SaaS company with $500K ARR, a single enterprise customer might consume 40 hours of onboarding, 20 hours of monthly support, and 10 hours of quarterly business reviews. At a typical blended rate of $85 per hour, that is $5,950 per month in labor alone.
Overhead allocation is the step most owners skip. Rent, software subscriptions, insurance, and administrative salaries must be distributed across customers. A simple method is to allocate overhead as a percentage of revenue. For example, if overhead is $120,000 per year and total revenue is $1.2 million, each dollar of revenue carries $0.10 of overhead. A customer paying $60,000 per year carries $6,000 in overhead cost.4
Special handling costs include returns processing, rush shipping, custom integrations, and legal review. These are often buried in general expense categories. Identifying unprofitable customers requires tracking data on returns and resource drains, which most SMBs fail to do systematically.5
| Cost Category | Example | Annual Cost for a $50K Customer |
|---|---|---|
| Direct labor | Support, account management, onboarding | $18,000 |
| Product cost | COGS or service delivery cost | $15,000 |
| Overhead allocation | 10% of revenue | $5,000 |
| Special handling | Returns, rush orders, custom work | $4,000 |
| Total cost-to-serve | $42,000 | |
| Net profit | $8,000 (16% margin) |
Identifying the Margin Drains Hiding in Your Client Base
Once the cost-to-serve is calculated, the next step is to identify specific margin drains within each customer relationship. Three drains account for the majority of hidden losses: scope creep, excessive communication, and payment friction.
Scope creep occurs when the customer receives work that was not in the original agreement. For a marketing agency, this might be extra rounds of revisions, additional ad platforms, or rush deadlines. The cost of scope creep is rarely billed. Over a year, it can add 15% to 25% to the cost-to-serve without any revenue increase2.
Excessive communication is harder to quantify but equally damaging. A customer who emails five times per day, requests weekly status calls, and demands detailed reports is consuming account management hours that could serve three other clients. For a business with a $150 hourly rate, a customer who requires two extra hours of communication per week costs $15,600 per year.
Payment friction includes late payments, invoice disputes, and chargebacks. A customer who consistently pays 30 days late forces the business to carry their receivables. If the business has a 10% cost of capital, a $10,000 invoice paid 30 days late costs $83 in financing. Over a year with multiple invoices, that adds up.
The Renegotiation Playbook for Underperforming Contracts
For customers identified as break-even or unprofitable, the first step is renegotiation, not termination. The goal is to adjust the contract terms so the relationship becomes profitable.
Start with pricing. Suppose the cost-to-serve is 45% of revenue and the target is 30% — the price would need to increase by roughly 50%. For a hypothetical customer paying $2,000 per month, the new price would be about $3,000. Present this as a value-based increase tied to the actual services delivered. Provide a breakdown of hours and costs so the customer understands the math.
If the customer cannot accept a price increase, adjust the scope. Reduce the number of included revisions, limit support hours, or move to a tiered service model. For a hypothetical consulting client paying $4,000 per month for unlimited support, switch to a model that includes 10 hours of support and charges $200 per hour beyond that. A customer who uses 15 hours per month under this model would pay, for example, $5,000, and the margin recovers.
The third option is to change payment terms. Move from net-30 to net-15, or require a deposit. For customers with a history of late payments, require automatic credit card billing. This reduces the cost of carrying receivables and improves cash flow.
| Renegotiation Lever | When to Use | Expected Margin Improvement |
|---|---|---|
| Price increase | Cost-to-serve exceeds 40% of revenue | 10-20 percentage points |
| Scope reduction | Customer uses more resources than contracted | 15-25 percentage points |
| Payment terms change | Customer pays late or disputes invoices | 2-5 percentage points |
When to Fire a Customer vs Fix the Relationship
Not every customer can be saved. The decision to fire a customer comes down to three factors: the size of the loss, the strategic value of the relationship, and the customer's willingness to change.
Fire the customer if the annual loss is substantial — for example, exceeding $10,000 — and the customer has rejected two renegotiation attempts. Suppose a customer costs $15,000 per year to serve and generates $12,000 in revenue — that's a net loss of $3,000 annually. Over five years, that hypothetical loss compounds to $15,000 in destroyed value.
Keep and fix the customer if the loss is small, the customer provides strategic value such as referrals or industry credibility, or the customer agrees to the renegotiated terms. A break-even customer who refers three new clients per year is worth keeping, even if the direct margin is zero.
The decision framework is straightforward. If the customer is unprofitable and unwilling to change, terminate the relationship professionally. Provide 30 to 60 days notice, offer a transition plan, and avoid burning the bridge. The freed capacity can be redirected to profitable customers or used to acquire new ones.
Tracking Profitability Changes With a Monthly Review Cadence
Customer profitability is not a one-time analysis. It changes as costs shift, customers grow, and contracts evolve. A monthly review cadence ensures that margin erosion is caught early.
Create a simple dashboard that tracks three metrics per customer: revenue, cost-to-serve, and net margin percentage. Update it at the end of each month. Flag any customer whose margin dropped by more than 5 percentage points compared to the prior month. Investigate the cause within the first week of the next month.
For a business with 20 to 50 customers, the monthly review should take two to three hours. The owner or a senior team member reviews the flagged accounts, checks for scope creep or support spikes, and decides whether to initiate a renegotiation. Over six months, this cadence catches problems before they become critical.
The cost of not reviewing is invisible but real. Suppose a customer's margin drops from 30% to 15% over six months — for every $10,000 in revenue, that is $1,500 in lost profit per year. Across five such customers, the annual loss reaches $37,5002.
Your Next Step
Run a customer profitability analysis small business on your top ten customers by revenue this week. Pull the last twelve months of support hours, returns data, and payment history for each one. Calculate the cost-to-serve using the table above. If any customer shows a cost-to-serve ratio above 40%4, prepare a renegotiation proposal with a 15% price increase and a scope reduction. Send the proposal within 14 days. For questions on building your diagnosis tree, contact [email protected].
Footnotes
-
https://myabcm.com/customer-profitability-how-to-ensure-sustainable-profits ↩ ↩2
-
https://www.kaplancollectionagency.com/business-advice/54-small-business-statistics-for-2025 ↩ ↩2 ↩3 ↩4 ↩5 ↩6
-
https://verdegroup.com/blog/3-steps-to-fire-the-worst-and-transform-unprofitable-into-profitable-customers ↩ ↩2 ↩3
-
https://strategiccfo.com/articles/profitability/identifying-profitable-customers ↩