What Your Customer Concentration Ratio Actually Means
A customer concentration ratio measures what portion of your total revenue comes from a single customer. It is the percentage you get when you divide revenue from one client by total company revenue. The SEC requires disclosure for any customer exceeding 10% of total revenue for public filings,1 and lenders typically flag risk above 25% for private SMBs.
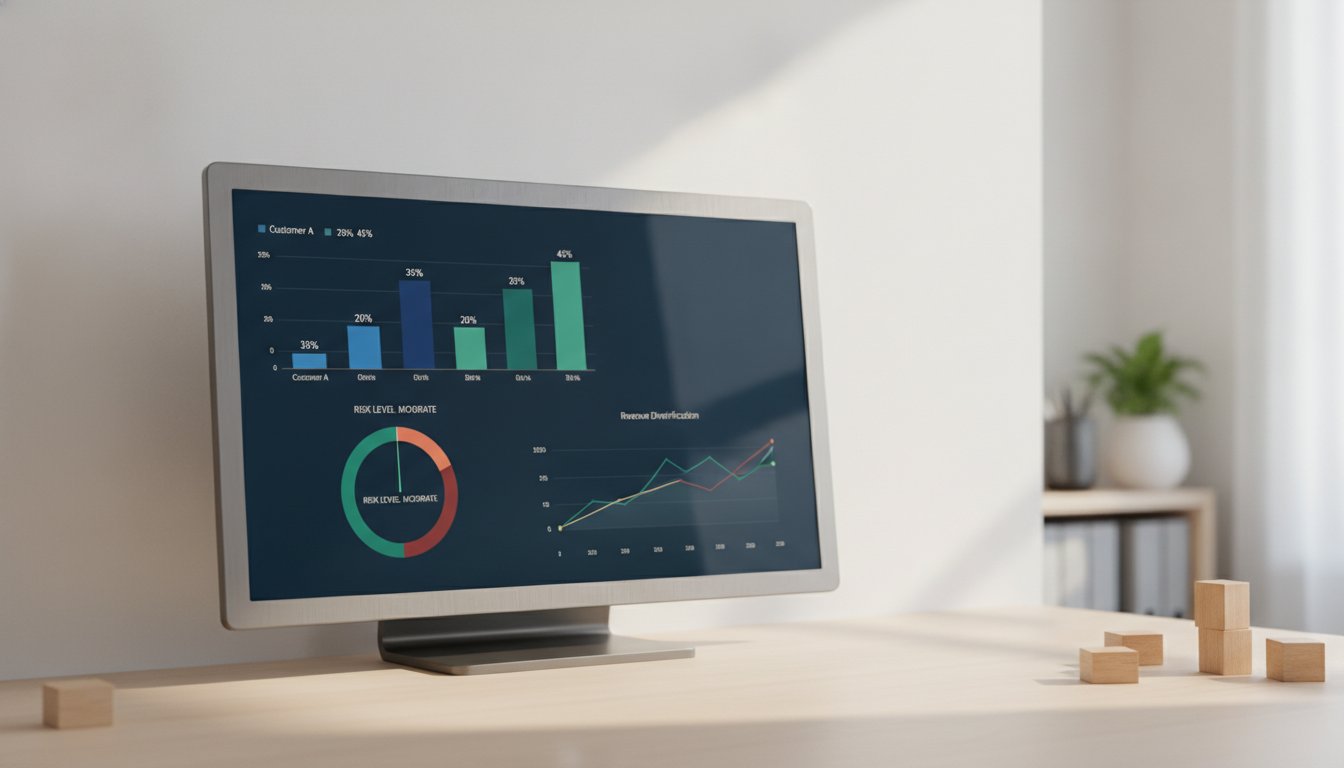
Customer concentration ratio answers a simple question: how much of your revenue depends on one relationship? The formula is straightforward — revenue from Customer A divided by total revenue, expressed as a percentage. If you have $2 million in total revenue and your largest customer pays you $800,000, your concentration ratio for that customer is 40%.
The SEC considers any customer exceeding 10% of total revenue a concentration risk for public filings.1 For private SMBs, the threshold is higher in practice but the logic is the same. A ratio above 25% means losing that customer would require cutting 25% of your costs overnight — something most businesses cannot do without breaking operations.
Consider a hypothetical SaaS company with $500K ARR and one customer paying $200K annually. That ratio means the founder cannot make strategic decisions without first asking what the large customer will do. The ratio quantifies a dependency that owners often feel intuitively but cannot articulate in numbers.
What Customer Concentration Ratio Tells You About Risk
The ratio itself is a diagnostic number, but what matters is how it maps to real business outcomes. A 2023 study by the Small Business Administration found that 44% of small businesses that fail cite customer concentration as a primary factor.2 That statistic puts a number on a pattern fractional finance professionals see regularly: one customer leaves, and the business cannot absorb the revenue gap.
The Herfindahl-Hirschman Index (HHI), the standard formula the DOJ uses to measure market concentration, can be adapted to measure customer concentration risk.3 To calculate HHI for your customer base, square each customer's revenue share percentage and sum the results. A single customer at 50% produces an HHI of 2,500 — the DOJ considers markets above 2,500 highly concentrated. The same logic applies to your revenue base.
A customer concentration ratio above 50% from a single client typically triggers a "key person" discount of 15-25% on business valuation, according to the IBBA Market Pulse report.4 That means a business with that concentration level would sell for 75-85 cents on the dollar compared to a diversified peer — buyers discount the revenue stream because its loss would require cutting more than half of expenses overnight.
The 5-Minute Calculation Using Your Revenue Data
Pull your revenue report for the trailing twelve months. List every customer that paid you more than $10,000 during that period. Sort the list from highest revenue to lowest. A higher threshold reduces noise from minor transactions and focuses the analysis on meaningful customer relationships.
Step one: divide revenue from your largest customer by total revenue. Multiply by 100. That is your single-customer concentration ratio. If your largest customer represents $300,000 of $1 million total, your ratio is 30%.
Step two: repeat for your second and third largest customers. Many SMBs find that their top three customers combined represent a high percentage of total revenue — for example, 70-80% — even when no single customer exceeds half of the total.
Step three: calculate your HHI score. Take each customer's percentage share, square it, and add all the squares together. For a business with three customers at 40%, 35%, and 25%, the HHI is 1,600 + 1,225 + 625 = 3,450. Any HHI above 2,500 signals high concentration risk.
The average SMB loses 20% of annual revenue when their top customer churns, based on data from the 2024 SMB Churn Report by ProfitWell.5 That number makes the calculation worth the five minutes it takes.
Interpreting Your Ratio: Safe Zone vs Danger Zone
| Concentration Ratio (Single Customer) | Risk Level | Typical Valuation Impact |
|---|---|---|
| Below 10% | Low | None |
| 10% - 25% | Moderate | Minimal discount |
| 25% - 50% | High | 5-15% valuation discount |
| Above 50% | Critical | 15-25% key person discount4 |
A ratio below 10% means no single customer can destabilize your business. Between 10% and 25%, you should monitor the relationship but likely do not need immediate action. Above 25%, you have a structural risk that affects your ability to raise capital, sell the business, or survive an unexpected departure.
The danger zone accelerates quickly. A business at 30% concentration — a typical threshold for many SMBs — can lose one customer and still operate, though painfully. A business at 60% concentration that loses its top customer must cut more than half its expenses — layoffs, office closure, or both — within weeks.
Fractional CFO engagements indicate that most SMB clients with revenue under $5 million lack formal customer concentration tracking in place.6 Most owners discover their ratio only when applying for a loan or preparing for sale, at which point the risk is already embedded in their operations.
How Lenders and Investors Evaluate Concentration
Banks and institutional lenders treat customer concentration as a credit risk factor. A commercial loan underwriter reviewing a business with 40% single-customer concentration will typically require a personal guarantee, a higher interest rate, or additional collateral. Some lenders cap exposure at 25% per customer in their underwriting guidelines.
Private equity buyers and strategic acquirers conduct concentration analysis during due diligence as a standard procedure. A target company with one customer above, for example, 30% of revenue will face a purchase price adjustment or an earn-out structure that protects the buyer if that customer leaves post-acquisition. The 15-25% valuation discount from the IBBA data applies directly to these transactions.4
For SMBs seeking lines of credit, lenders often request a customer concentration schedule alongside financial statements. A business with a ratio above 50% may find its credit line capped at roughly half of what it would receive with a diversified base. The ratio directly affects how much capital you can access and at what cost.
Three Strategies to Reduce Customer Dependency
Expand within existing accounts. Identify products or services your top customer buys from competitors and offer them. A manufacturing business whose largest customer buys only raw materials might offer assembly services to that same customer. Increasing wallet share with one client does not reduce concentration, but it deepens the relationship and makes replacement harder for the customer.
Target mid-tier customers systematically. Most SMBs chase large accounts and ignore the middle. Build a list of 20 prospects in a typical annual revenue range of $20,000 to $50,000. Acquiring five of them replaces the revenue of one large customer while spreading risk across multiple relationships. The effort-to-revenue ratio is worse per account, but the stability gain is significant.
Set a maximum concentration threshold as a board-level metric. Treat anything above 25% from a single customer as a formal risk that requires a documented mitigation plan. Review the ratio quarterly. If it rises, allocate sales resources to the mid-tier pipeline before the ratio hits a level that triggers the board's risk threshold — for example, 40%.
When to Bring in a Fractional CFO for Diversification
A fractional CFO becomes valuable when your concentration ratio exceeds 25% and you lack the internal finance team to build a diversification model. CurrentCFO specializes in these engagements for SMB owners — the focus is on three deliverables: a customer concentration dashboard updated monthly, a revenue diversification plan with specific target accounts and timelines, and a financial model that shows how revenue shifts affect profitability at different concentration levels.
The cost of a fractional CFO typically ranges from $2,000 to $8,000 per month depending on complexity.5 For a business with $2 million in revenue and a 40% concentration ratio, that cost represents 0.1-0.4% of revenue — a fraction of the 20% revenue loss that occurs when the top customer churns.5
Most fractional CFO engagements for concentration risk last 6-12 months. The goal is to build internal systems and a diversified pipeline so the business no longer needs external financial oversight for this specific risk. After the engagement, the owner receives a quarterly one-page concentration report they can maintain themselves.
Your Next Step
Run the three-step calculation on your trailing twelve months revenue data today. Write down your single-customer ratio and your HHI score. If either number exceeds the thresholds in this article, send both numbers to [email protected] with the subject line "Concentration Review" and include your total revenue and industry. You will receive a one-page diagnostic within three business days that maps your specific ratios to valuation impact and diversification timeline — no sales call required.