The Profit Illusion: When Your P&L Says "Go" But Your Bank Account Says "No"
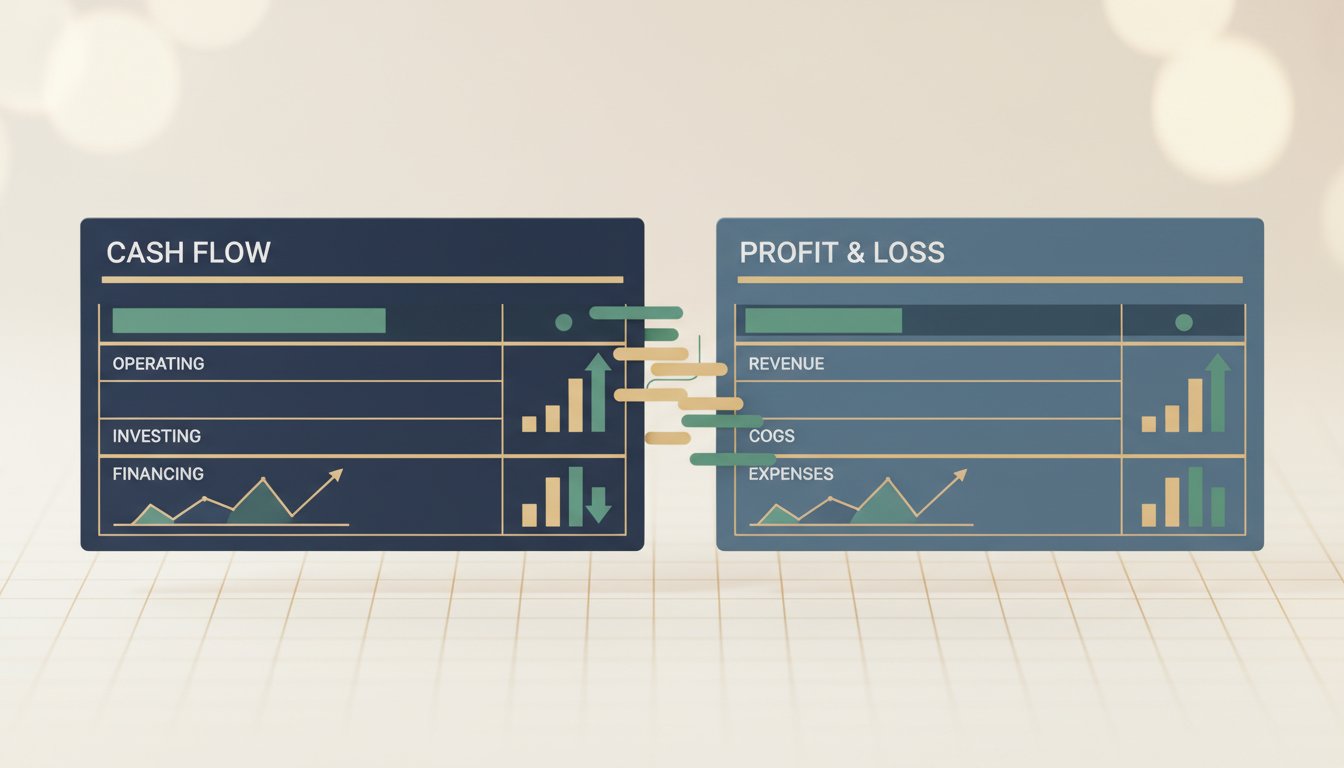
Your profit and loss statement shows a healthy net income, but your bank account is empty. This disconnect between profitability and liquidity is the most critical financial blind spot for small business owners. A cash flow statement vs profit and loss for small business is the comparison of two essential reports: the P&L measures profitability over a period, while the cash flow statement tracks the actual movement of money in and out of your bank accounts. Understanding the difference is not academic; it's a survival skill.
According to a U.S. Bank study, 82% of small businesses fail due to cash flow problems1. This guide dissects both statements side-by-side, showing you exactly where to look for warning signs and how to use each report to make confident operational decisions.
Consider a hypothetical marketing agency, "Alpha Creative," with $2 million in annual revenue. Its quarterly P&L shows a solid $120,000 net profit. Yet, on Friday, the founder, Sarah, faces a crisis: she cannot meet the $40,000 payroll due on Monday. The profit is real on paper, but the cash is not in the bank. This "profit illusion" occurs because the P&L operates on the accrual basis of accounting—it records revenue when earned and expenses when incurred, regardless of when cash changes hands. The cash flow statement, however, is a strict record of cash transactions. The gap between these two reports explains why a business can be profitable yet illiquid.
The JPMorgan Chase Institute found the average small business has only 27 days of cash reserves2, making this understanding urgent. For SMB owners, mistaking the P&L's green numbers for financial health can lead to catastrophic decisions, like expanding overhead or taking on new projects without the liquid capital to support them.
The Core Difference: Profit vs. Cash in the Bank
Profit, or net income, is an accounting concept. Cash is a tangible resource. The fundamental difference lies in timing and the treatment of certain critical transactions.
| Aspect | Profit and Loss (P&L) | Statement of Cash Flows |
|---|---|---|
| Purpose | Measures profitability and operational performance over a period. | Tracks the sources and uses of actual cash. |
| Basis | Accrual accounting (revenue earned, expenses incurred). | Cash accounting (cash received, cash paid). |
| Key Exclusions | Excludes principal loan repayments and purchases of assets. | Includes all cash movements, including loans and asset purchases. |
| Primary Question Answered | "Is the business making money on its operations?" | "Where did the cash come from, and where did it go?" |
For instance, a $100,000 sale to a customer on net-60 terms boosts your profit today, but your cash balance won't increase for two months. Conversely, a $50,000 equipment purchase hits your cash balance immediately but only affects the P&L gradually through depreciation over several years. Your P&L could show a profit while your cash flow statement reveals a net cash drain, signaling an impending liquidity crisis.
How to Read Your Profit and Loss Statement (P&L)
The P&L, or income statement, follows a straightforward formula: Revenue – Expenses = Net Income. For an SMB owner, the key is to look beyond the bottom line. Start at the top with gross profit (Revenue – Cost of Goods Sold), which indicates your core production efficiency. Then, scrutinize operating expenses. A common pitfall is letting overhead creep grow faster than revenue growth, squeezing net profit margins. The P&L is your tool for measuring operational efficiency and pricing strategy. It answers whether your business model fundamentally works. However, it tells you nothing about your ability to pay bills next week.
Many accounting software packages, like QuickBooks, allow P&L reports on either a cash or accrual basis—a critical setting that many owners miss and which can dramatically alter the profit figure shown. When reviewing your P&L, always confirm which basis your report uses, as this directly impacts what you're seeing.
How to Read Your Statement of Cash Flows
This statement is divided into three sections, but for operational decision-making, start with the bottom line: Net Change in Cash. This number tells you if you added to or drained your cash reserves during the period. A negative number is an immediate red flag requiring investigation. The statement reconciles your net income from the P&L with your net cash flow, explicitly showing the adjustments for non-cash items (like depreciation) and changes in working capital (like accounts receivable and inventory).
To read the cash flow statement effectively, track the trend in "Cash Flow from Operating Activities." This is the cash generated by your core business. If this number is consistently negative, even with positive net income, your business is consuming cash to operate—an unsustainable position. The 13-week cash flow forecast, the standard planning tool used by CFOs, is built from the logic of this statement, projecting these cash movements into the near future.
When Your P&L Shows Profit But You Have No Cash
This scenario is typically caused by four cash traps that appear on the cash flow statement but not the P&L:
- Growth in Accounts Receivable: You book $150,000 in sales in a month, increasing profit. However, if customers are slow to pay, that $150,000 is tied up in receivables, not in your bank account. Rapid growth often exacerbates this drain.
- Inventory Purchases: Cash spent to buy inventory is not an expense on the P&L until the inventory is sold. A retailer stocking up for the holiday season might see cash plummet while profits remain steady.
- Capital Expenditures: Purchasing a $25,000 vehicle for deliveries uses cash today. On the P&L, only a portion of that cost (depreciation) is expensed each year.
- Debt Repayment: Making a $10,000 principal payment on a loan reduces your cash balance. On the P&L, only the interest portion is an expense; the principal repayment is invisible.
These activities are investments in growth or obligations of the business, but they consume cash now while their P&L impact is delayed or absent. This is why a profitable business can run out of money.
The Three Cash Flow Categories: Operating, Investing, Financing
The statement of cash flows is segmented by these three activities, as required by GAAP3. Understanding each category's normal state is crucial for analysis.
| Category | What It Includes | Healthy Sign for a Growing SMB |
|---|---|---|
| Operating Activities | Cash from core business: customer receipts, payments to suppliers/employees, interest/taxes paid. | Positive. This indicates the core business is generating cash. |
| Investing Activities | Cash for long-term assets: purchases/sales of equipment, property, or other businesses. | Negative. This shows the business is investing in its future capacity. |
| Financing Activities | Cash from/to owners and creditors: loan proceeds/repayments, owner draws/contributions, dividends. | Variable. May be positive if raising capital, negative if repaying debt. |
A healthy, growing SMB often shows a pattern of positive cash from operations, negative cash from investing (as it reinvests), and variable cash from financing. A warning sign is negative cash from operations, meaning the business model is not generating its own cash and relies on external financing to survive.
Which Statement to Use for Key Business Decisions
Each financial statement serves a distinct purpose in guiding specific decisions.
| Business Decision | Primary Statement to Use | Why |
|---|---|---|
| Setting Prices or Cutting Costs | Profit and Loss (P&L) | The P&L directly shows gross margins and the impact of expense changes on profitability. |
| Managing Day-to-Day Liquidity (Payroll, Vendors) | Cash Flow Statement & Forecast | This tells you the actual cash you have available to meet short-term obligations. |
| Planning a Major Equipment Purchase | Cash Flow Statement & Forecast | You need to model the large, immediate cash outlay and its impact on future cash reserves. |
| Evaluating Business Model Health | Profit and Loss (P&L) | Consistent net income growth indicates a viable, scalable model. |
| Securing a Loan or Line of Credit | Both | Lenders assess profitability (P&L) for ability to repay and cash flow for ability to service debt payments. |
| Deciding on Owner Distributions | Cash Flow Statement | Distributions should only come from surplus cash after all operational and investment needs are met. |
Integrating Both Reports for a Complete Financial Picture
The most effective SMB finance leaders don't choose one statement over the other; they integrate them. The process begins with the P&L to establish the baseline profit expectation. Then, you layer in the cash flow implications: When will those sales actually be collected? When are the major bills due? This integration is the essence of cash flow forecasting.
For example, if your P&L projects a $50,000 profit next quarter, but your cash flow forecast accounts for a new equipment purchase and seasonal inventory build, you may see a $20,000 cash deficit. This integrated view allows for proactive measures, like arranging a line of credit in advance. The SBA recommends maintaining a cash reserve equal to 3-6 months of operating expenses4—a target that can only be managed by synthesizing insights from both reports.
Your Next Step
This week, pull your most recent P&L and statement of cash flows. Place them side-by-side and perform this single diagnostic: identify the largest difference between your net income (from the P&L) and your net cash flow from operations (from the cash flow statement). Trace that difference to its source—is it a growth in receivables, an inventory purchase, or another item? That source is your most significant cash trap. Understanding it is the first step toward aligning your profitability with your liquidity.
For a structured worksheet to guide this comparison, email [email protected].
Footnotes
-
U.S. Bank, "Small Business Failure Study," https://www.usbank.com/small-business/failure-study ↩
-
JPMorgan Chase Institute, "Cash is King: Flows, Balances, and Buffer Days," https://www.jpmorganchase.com/institute/research/small-business/cash-is-king-flows-balances-and-buffer-days ↩
-
Generally Accepted Accounting Principles (GAAP), ASC 230, Statement of Cash Flows. ↩
-
U.S. Small Business Administration (SBA), "Manage Your Cash Flow," https://www.sba.gov/business-guide/manage-your-business/manage-your-cash-flow ↩